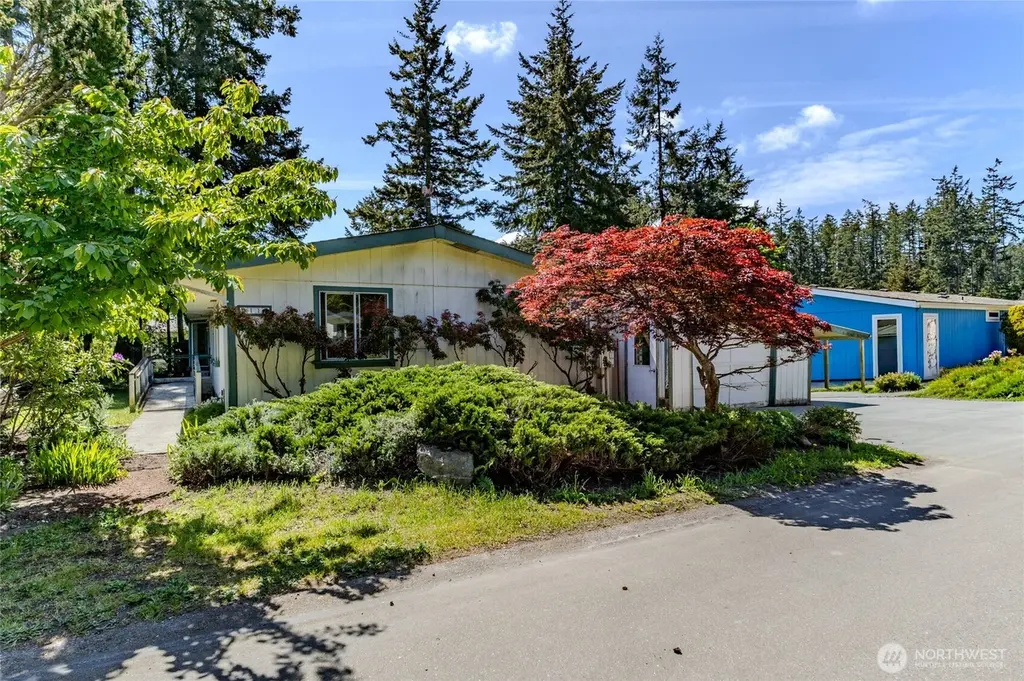
2119 Victoria Ave · Port Townsend, WA
Flood risk 1/10 · Minimal
- FEMA flood zone
- X (unshaded)
- Chance of flooding over 30 yrs
- 0.0%
- Est. flood insurance / yr
- $507 – $1,088
Fire risk 1/10 · Minimal
- Est. fire insurance / yr
- $604 – $1,122
Heat risk 2/10 · Minimal
- Hot days now (above 82°F)
- 8 days/yr
- Hot days in 30 yrs
- 19 days/yr
Wind risk 1/10 · Minimal
- Chance of severe wind over 30 yrs
- —
Air-quality risk 6/10 · Moderate
- Unhealthy air days now
- 9 days/yr
- Unhealthy air days in 30 yrs
- 9 days/yr
Risk factors via First Street. Map © Google.
Why this score? — see what drove the B- grade
The composite is a weighted blend of 9 inputs, each scored 0–100. Each bar is that input's sub-score; the figure is the points it added to the 100-point composite (weight × sub-score).
- Cash flow +25.9/30.0
- ARV discount +15.0/15.0
- DSCR +8.7/10.0
- 1% rule +7.3/10.0
- Schools +4.9/10.0
- Livability +2.9/5.0
- Rent growth +2.5/5.0
- Condition / age +2.5/5.0
- Appreciation +0.0/10.0
$249,000
🖨 Deal sheet (PDF) 📄 Offer letter ✓ Due diligence
Listing remarks
Affordable Towne Point gem! Opportunity knocks for those seeking affordable homeownership with room to grow. This 1990 manufactured home offers over 1,600 sqft of living space, 4 bedrooms, 2 full baths, laundry room to single car garage and covered carport. This home needs updates, however, ideal option for buyers ready to build thoughtful improvements. Priced with condition in mind. PR will allow a carpet credit at closing.
Key facts
- 6,098 sq ft lot
- Garage
- Built 1991
Property features AI
Finance
- Other: Lot is paved and level with garden space; Located in a city zoning jurisdiction (R-II); Lot number 153; Bus line nearby
- Financial info: Accepts Cash, Conventional and Rehab loans
- HOA & community: Monthly HOA fee of $50 covering common area maintenance; Association contact available; Community amenities include athletic court, clubhouse, park, playground and trails; community CCRs
Exterior
- Parking: Attached garage; Attached carport; Driveway; Covered parking for 2 vehicles
- Security: Partially fenced yard
- Utilities: Public water; Public sewer (connected); Electric and propane energy sources; Electric water heater; Power provided by Jefferson County PUD #1
- Home design: Single-family manufactured home; One story; Main entry; Has view; Good condition
- Construction: Built in 1991 (effective year); Wood construction; Composition roof; Block foundation
- Exterior features: Wood siding/products; Deck; Partially fenced; Outbuildings; Propane on-site; Cable TV available
Interior
- Kitchen: Dishwasher; Stove/Range; Refrigerator
- Bedrooms: 4 bedrooms (all on the main level)
- Flooring: Carpet
- Bathrooms: 2 full bathrooms; 2 bathtubs; 2 showers
- Heating & cooling: Forced air heating; Freestanding stove; No central cooling
- Interior features: Fireplace; Skylights; Vaulted ceilings; Water heater
- Laundry & utility: Washer; Dryer
Neighborhood map
What this means for you Summary
Snapshot
- This is a 4-bed/2.0-bath manufactured listed at $249k.
Deal economics
- At list price, monthly cash flow is $614 ($7k/yr) — positive.
- The deal already cash-flows at list — no discount required.
- Meets the 1% rule at list price ($3k rent vs $249k).
- Cap rate 9.3% vs local median 2.5% in Port Townsend — top-decile yield for the area; either an underpriced asset or a hidden risk that comps aren't pricing in. Stress-test before assuming the spread holds.
Location & tenants
- Location reads 58/100 on livability (#506 in WA) — a working-class tenant base; expect higher turnover. Watch: health & safety C-, employment D+, crime D.
- Port Townsend School District (town): math 47% / reading 64% proficiency, ranked #101 of 291 in WA (top 35%) — acceptable for families but not a draw, mixed tenant base, ~2y average lease.
- Zoned schools: Salish Coast Elementary (441 students, 51% FRL); Port Townsend High School (377 students, 49% FRL).
- Market conditions: 204 active listings in the ZIP; 147 units permitted in Jefferson County in 2024 (0 in 5+ unit buildings).
- At $3,062/mo this rent would consume 53% of the median local household income ($70k/yr) (locally 345% of renters already pay >50% of income on rent) — very limited rent-growth headroom before tenants either downsize or default.
Forward outlook
- Local home prices are declining (-3.0%/yr); year-one equity from $2k of loan paydown is wiped out by about $7k of value loss. Plan a longer hold.
- Jefferson County population projected to shrink 5% by 2050 — rents likely to lag national; underwrite the cash flow, not the appreciation.
Negotiation context
- Only 1 days on market — expect competitive offers; lowballing is unlikely to land.
- 3 sale attempts since 23y ago with the ask held roughly flat each time — persistent listings suggest the price (not the market) is what's stuck; bring a comps-based counter.
- Current owner paid $145k; list at $249k implies a 72% gain — meaningful room to come down on a strong offer.
Questions for the listing agent
- What does the HOA fee cover, when was the last increase, and are there any pending special assessments or reserve-fund shortfalls?
- Is there a deadline driving the sale (1031 exchange, divorce, estate, relocation)? That informs how much negotiation room exists.
- Crime grade is D in this area — have there been break-ins, vandalism, or insurance claims at this property in the last 3 years? What carrier currently insures it and at what premium?
- What's the average days-on-market for RENTAL listings here right now (not sales)? A rising rental-DOM trend means longer vacancies and softer asking-rent achievability than the comps imply.
- What's the recent tenant-quality profile in this submarket — average credit score on applications, eviction rate, late-payment / NSF rate, and stable-employment percentage? A property-management company in the area should have these aggregated.
- How much new for-sale + rental construction is in the pipeline within 1–3 miles? Heavy new supply typically softens prices + rents 12–24 months out; constrained supply supports both.
Investment metrics
- 1% rule
- 1.23% ✓
- Cap rate
- 9.25%
- Cash-on-cash
- 10.57%
- DSCR
- 1.47
- GRM
- 6.8
CMA / ARV
- ARV (on-the-fly)
- $448,026
- Comps found
- 6
Show comp detail 6 sales within ~0.75 mi
| Address | Dist | Beds/Ba | Sqft | Sold | Price | $/sf | Match |
|---|---|---|---|---|---|---|---|
| 2119 Victoria Ave | 0.00mi | 4/2.0 | 1,678 (0%) | 1mo | $249,000 | $148 | 99 |
| 2624 Highland Loop | 0.31mi | 3/2.0 (-1) | 1,694 (+1%) | 0mo | $440,000 | $260 | 79 |
| 2182 Beacon Pl | 0.11mi | 3/2.0 (-1) | 1,687 (+0%) | 13mo | $450,000 | $267 | 78 |
| 2194 Victoria Ave | 0.11mi | 3/2.0 (-1) | 1,692 (+1%) | 21mo | $362,815 | $214 | 71 |
| 2289 Towne Point Ave | 0.18mi | 3/2.0 (-1) | 1,480 (-12%) | 3mo | $420,000 | $284 | 65 |
| 2399 Highland Loop | 0.37mi | 3/2.0 (-1) | 1,560 (-7%) | 4mo | $530,000 | $340 | 63 |
Match score weights: distance 35% · size 25% · config 20% · recency 20%. Top-matched comps best support the ARV.
Projected returns pro-forma
-3.0% appreciation · 3.0% rent growth · sell at horizon
- IRR
- -0.4%
- Equity multiple
- 0.98×
- Total profit
- $-1,153
- Equity at exit
- $37,127
- IRR
- 9.3%
- Equity multiple
- 1.71×
- Total profit
- $49,740
- Equity at exit
- $21,529
Cash invested: $69,720 (down + closing). Projections, not guarantees.
Landlord ↔ Tenant lean methodology
- Overall (STATE)
- 28 Tenant-Leaning
- State Washington
- 28 Tenant-Leaning · D+8
- County
- — inherits STATE
- City
- — inherits STATE
ZIP-level market 98368
- Active inventory
- 204
- Price-to-rent
- 6.8×
Monthly cashflow live
- Estimated rent
- $3,062 medium interval (Pro) →
- Mortgage (P&I)
- −$1,306
- Tax from tax record
- −$223 /mo · $2,681/yr
- Insurance
- −$104
- HOA
- −$172
- Vacancy / Maint / Mgmt
- −$643
- Net cashflow
- $614
Break-even live
Sensitivity live
| Price | -10% $755 | -5% $684 | +0% $614 | +5% $543 | +10% $473 |
|---|---|---|---|---|---|
| Rent | -10% $372 | -5% $493 | +0% $614 | +5% $735 | +10% $856 |
| Rate | -1.0pp $739 | -0.5pp $677 | base $614 | +0.5pp $549 | +1.0pp $484 |
UW: 25.0% down · 7.5% · 30yr · 1.5% tax · 5.0% vac · 8.0% maint · 8.0% mgmt
Financing live
Cash to close
- Down payment
- $62,250
- Closing costs
- $7,470
- Reserves months
- —
- Total cash needed
- —
Loan-product check · same deal, 3 products live
Conventional
25% down · 7.5% · 30yr
- Down + closing
- —
- Monthly P&I
- —
- Monthly cashflow
- —
- DSCR
- —
- Eligible?
- —
Personal DTI + credit; lowest rate.
DSCR
20% down · 8.5% · 30yr
- Down + closing
- —
- Monthly P&I
- —
- Monthly cashflow
- —
- DSCR
- —
- Eligible?
- —
No personal income docs; deal must DSCR.
Hard money
10% down · 12.0% · 12mo
- Down + closing
- —
- Monthly P&I
- —
- Monthly cashflow
- —
- DSCR
- —
- Eligible?
- —
Short-term bridge; refi at stabilization.
HOA detail
- Monthly dues
- $172 · $2,064/yr
Listing history 10 events
-
2026-05-12status Pending
-
2026-05-10status Pending - Backup Offer Requested
-
2026-05-08$249,000 Active
-
2003-07-02historical
-
2003-07-01soldstatus $145,000
-
2003-07-01soldstatus $145,000
-
2003-07-01soldstatus $145,000
-
2003-06-03historical
-
2003-04-24$145,000
-
2003-04-23$149,500
ⓘ Source: listings_history table (triggers on properties + properties_extension) + one-shot
backfill from property_details.listing_events for pre-trigger history.
Tax reassessment forecast WA · Resets to sale price
- Current annual tax
- $2,681 · $223/mo
- Projected year-2 tax
- $2,681 · $223/mo
- Expected delta
- $0/yr ($0/mo · 0.0%)
ⓘ Screening estimate from a state-policy table — verify with the county assessor before closing.
Climate risk First Street
- Flood 1/10 Low FEMA zone X (unshaded) · 0% chance over 30 yrs
- Wildfire 1/10 Low
- Heat 2/10 Low 8 d/yr ≥82°F today · 19 d/yr by 30 yrs out
- Wind 1/10 Low
- Air quality 6/10 Major 9 unhealthy d/yr today · 9 by 30 yrs out
Nearby sold comps map
Loading sold comps map…
Walkable amenities ~0.75 mi
Loading nearby amenities…
Taxation est. · year 1
- Rental income
- $36,742
- − Mortgage interest
- −$13,948
- − Property taxes
- −$2,681
- − Insurance
- −$1,245
- − Repairs & maintenance
- −$2,939
- − Management
- −$2,939
- − HOA
- −$2,064
- − Depreciation
- −$7,244
- Taxable income
- $3,682
- Est. tax owed @ 24.0%
- −$884
- After-tax cash flow
- $6,483/yr
For passive investors: Depreciation is non-cash, so a rental often shows a tax loss while cash-flowing — sheltering income. Rental losses are passive: they offset passive income freely, and up to $25,000/yr can offset ordinary (W-2) income if you actively participate and your MAGI is under $100k (phasing out to $0 by $150k); unused losses carry forward. On sale, claimed depreciation is recaptured at up to 25%, and gains may owe capital-gains tax (a 1031 exchange can defer both). Figures are a year-1 estimate at your 24.0% rate — not tax advice; consult a CPA.
Schools (NCES district)
- District
- Port Townsend School District
- NCES district ID
- 5306840
- Math proficiency
- 47% ▼ -2.00%
- Reading proficiency
- 64% ▼ -2.00%
- Median HH income
- $46,686
- Composite
- 48.79/100
- National rank
- #4526
- State rank
- #101 of 291 in WA
Livability — Port Townsend
- Score
- 58/100
- State rank
- #506
- US rank
- #20880
Category grades
Schools grade is shown separately in the Schools card above.
Census & demographics
- Census place
- Port Townsend, WA
- County
- Jefferson County · 17,304 people
- City population
- 17,304
- Metro
- nan
- Population (ZIP)
- 17,304
- Household income
- $69,688
- Rent vs Own
- Severe rent burden
- 345.0
Population outlook (Jefferson County) Hauer SSP2
- Today (2025)
- 31,415 people
- By 2030
- 31,568 · +0.5%
- By 2040
- 30,911 · -1.6%
- By 2050
- 29,927 · -4.7%
- By 2075
- 28,489 · -9.3%
- By 2100
- 26,483 · -15.7%
Race, ethnicity, and origin ACS 2023
- Neighborhood character
- Predominantly White (87%)
- Race & ethnicity
- White 87% Two or more races 8% Hispanic / Latino 4% Asian 2%
- Common ancestry
- Slovak 7% Portuguese 5% Lithuanian 3%
- Foreign-born
- 6% · Canada, China
- Languages at home
- 92% English-only · Spanish 4% Chinese 1% French/Haitian/Cajun 1%
Political lean MEDSL · Jefferson
- 2024 margin
- Solid D (+45.3) · D 71.0% · R 25.7% · Other 3.2%
- 2008→2024 swing
- +10.7pp toward D · 2008: 34.6pp · 2024: 45.3pp
- All cycles
- 2024: D+45.3 2020: D+41.4 2016: D+32.7 2012: D+31.4 2008: D+34.6
Not yet ingested
- Civics
- —
Market trends
- HPI YoY
- ▼ -577.30%
- Current HPI
- 183.9706
- Rent YoY
- —
- Metro
- nan
- State GDP YoY
- ▲ 4.65%
- F500 in state
- 22
Industry mix (Fortune 500 HQ in WA)
| Industry | F500 HQs | Revenue |
|---|---|---|
| Retail | 2 | $269B |
|
||
| Technology / Retail | 1 | $638B |
|
||
| Technology | 1 | $245B |
|
||
| Telecommunications | 1 | $38B |
|
||
| Food / Beverage | 1 | $36B |
|
||
| Automotive / Trucks | 1 | $34B |
|
||
Price history
+66.6% since first listed10 events — show timeline
- 2026-05-12 Pending — NWMLS as Distributed by MLS Grid
- 2026-05-10 Pending — NWMLS as Distributed by MLS Grid
- 2026-05-08 Listed $249,000 NWMLS as Distributed by MLS Grid
- 2003-07-02 Delisted — NWMLS as Distributed by MLS Grid
- 2003-07-01 Sold (Public Records) $145,000 Public Records
- 2003-07-01 Sold (MLS) $145,000 NWMLS as Distributed by MLS Grid
- 2003-07-01 Sold (MLS) $145,000 NWMLS as Distributed by MLS Grid
- 2003-06-03 Delisted — NWMLS as Distributed by MLS Grid
- 2003-04-24 Listed $145,000 NWMLS as Distributed by MLS Grid
- 2003-04-23 Listed $149,500 NWMLS as Distributed by MLS Grid
Property tax history
+15.2%/yrLatest (2026): $2,681 · +9.4% YoY. Source: county tax records.
Cash-flow waterfall
monthlySold comps — $/sqft
last 12 mo · ≤1 miLoading sold comps…