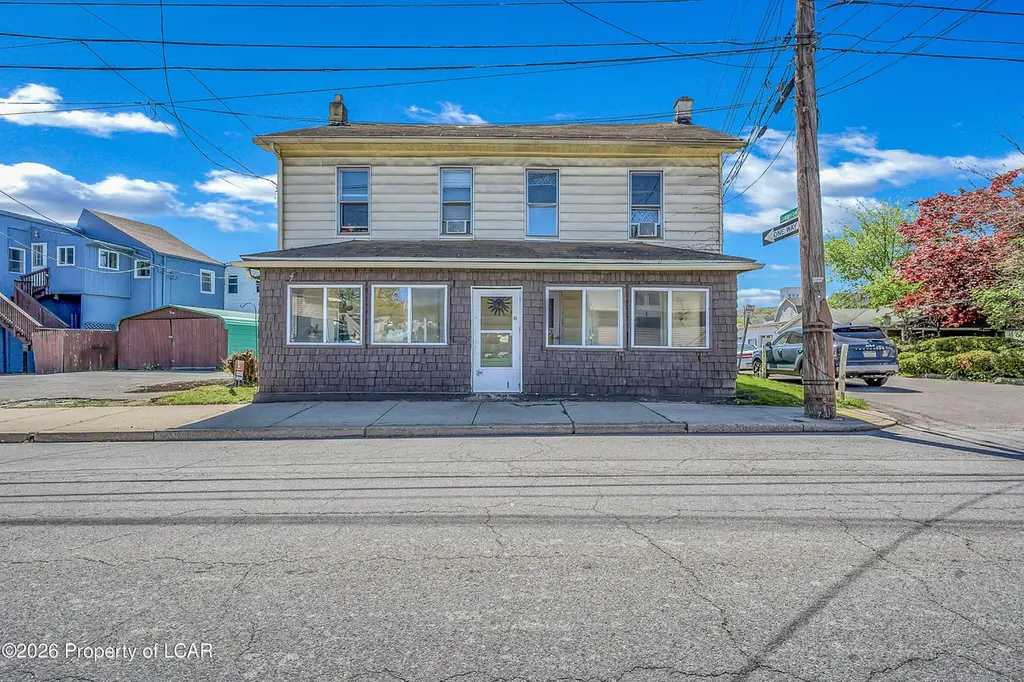
15 17 Cherry St
Plymouth, PA 18651
$125,000B+
4 bd · 2.0 ba ·
1,996 sqft ·
Built 1940
· MultiFamily
· Active
· 19 DOM
Cashflow @ list (25.0% down · 7.5%)
Estimated rent
$2,445/mo
Mortgage (P&I)
−$656
Tax + insurance
−$265
HOA
−$0
Vac / Maint / Mgmt
−$513
Net cashflow
$1,011/mo
Annual
$12,130/yr
Cap rate
16.63%
Cash-on-cash
36.93%
DSCR
2.64
1% rule
1.96%
Cash to close
$35,000
Investor read
- This is a 4-bed/2.0-bath multifamily listed at $125k.
- At list price, monthly cash flow is $1k ($12k/yr) — positive.
- The deal already cash-flows at list — no discount required.
- Meets the 1% rule at list price ($2k rent vs $125k).
- It's been on market 19 days — a 2% lower offer ($123k) is reasonable based on typical stale-listing flexibility.
- Recommended offer: $123k (1.5% below list) — sets the bar for market timing.
- Local home prices are declining (-3.0%/yr); year-one equity from $864 of loan paydown is wiped out by about $4k of value loss. Plan a longer hold.
- Location reads 66/100 on livability (#1,068 in PA) — a middle-class / working-renter tenant base. Strengths: cost of living A+, health & safety A+, housing B+; Watch: employment D, crime F, amenities F.
- Wyoming Valley West SD (suburban): math 18% / reading 42% proficiency, ranked #445 of 539 in PA (top 83%) — families likely to look elsewhere, expect single-tenant / working-renter base with shorter leases.
- Watch-outs: flood insurance adds $66/mo; built in 1940 — expect roof / HVAC / electrical / plumbing capex.
- Market conditions: 61 active listings in the ZIP; 11 comparable units currently listed for rent nearby; rentals at typical pace (median 22d on market — plan ~3-4 weeks tenant-placement turnaround); 45% of comp listings sitting > 30 days — soft ceiling on asking rent; 349 units permitted in Luzerne County in 2024 (16 in 5+ unit buildings).
- Luzerne County population projected at +4% by 2050 — modest demand growth; plan on rents tracking national, not racing it.
- 3 sale attempts; this cycle's ask has dropped $15k (11%) from the opening price — seller is motivated, your offer sets the floor, not the list.
- Current owner paid $40k; list at $125k implies a 212% gain — meaningful room to come down on a strong offer.
- At projected returns (-3.0% appreciation + 3.0% rent growth), your $35k cash investment doubles in ~4 years — after that, you're playing with house money.
- Climate carrying-cost: severe flood risk — expect insurance premiums to compound above CPI over the hold.
- Cap rate 16.6% vs local median 8.3% in Plymouth — top-decile yield for the area; either an underpriced asset or a hidden risk that comps aren't pricing in. Stress-test before assuming the spread holds.
Questions for listing agent
- Built in 1940 — when were the roof, HVAC, electrical panel, plumbing, and water heater last replaced?
- What's the actual annual flood-insurance premium (NFIP or private), and is the property in a SFHA with mandatory coverage?
- Is there a deadline driving the sale (1031 exchange, divorce, estate, relocation)? That informs how much negotiation room exists.
- Crime grade is F in this area — have there been break-ins, vandalism, or insurance claims at this property in the last 3 years? What carrier currently insures it and at what premium?
- What's the average days-on-market for RENTAL listings here right now (not sales)? A rising rental-DOM trend means longer vacancies and softer asking-rent achievability than the comps imply.
- What's the recent tenant-quality profile in this submarket — average credit score on applications, eviction rate, late-payment / NSF rate, and stable-employment percentage? A property-management company in the area should have these aggregated.
- How much new apartment / multifamily construction is in the pipeline within 1–3 miles? Heavy new supply (>2% of stock underway) typically softens rents 12–24 months out; light construction supports rent growth.
CashFlowRE · CFR-KMS4XY1ZF2Q9QR
· Data 2 days ago
cashflowre.app · 2026-05-29