 Multi-family
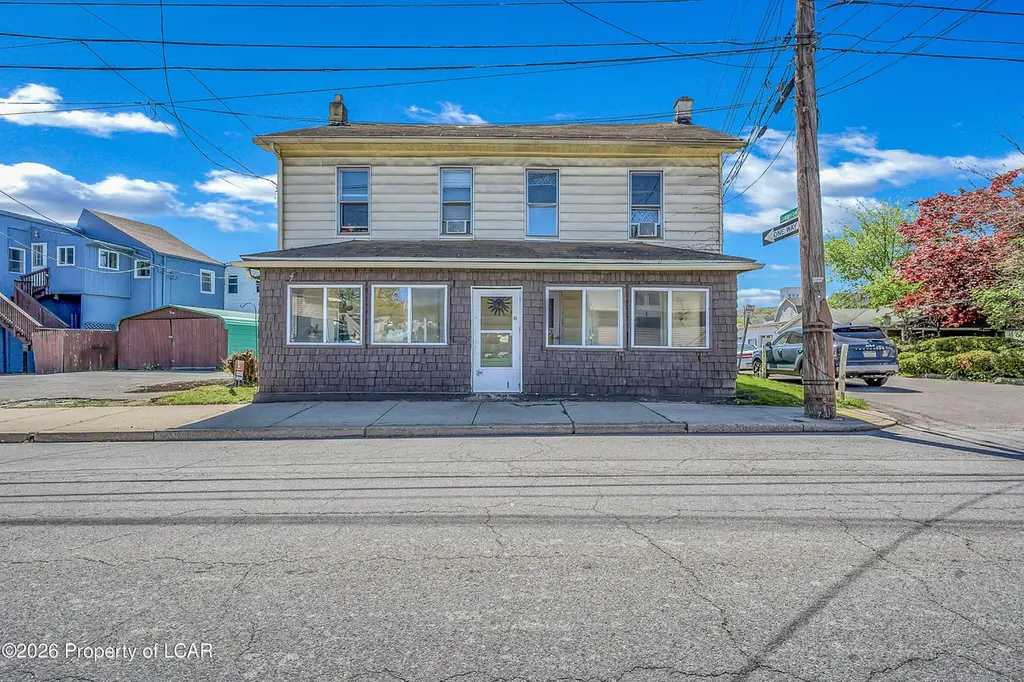
15 17 Cherry St · Plymouth, PA
Flood risk 8/10 · Major
- FEMA flood zone
- X
- Chance of flooding over 30 yrs
- 0.99%
- Est. flood insurance / yr
- $507 – $1,088
Fire risk 3/10 · Minor
- Est. fire insurance / yr
- $511 – $949
Heat risk 4/10 · Minor
- Hot days now (above 97°F)
- 7 days/yr
- Hot days in 30 yrs
- 17 days/yr
Wind risk 3/10 · Minor
- Chance of severe wind over 30 yrs
- 5.0%
Air-quality risk 2/10 · Minimal
- Unhealthy air days now
- 1 days/yr
- Unhealthy air days in 30 yrs
- 2 days/yr
Risk factors via First Street. Map © Google.
Why this score? — see what drove the B+ grade
The composite is a weighted blend of 9 inputs, each scored 0–100. Each bar is that input's sub-score; the figure is the points it added to the 100-point composite (weight × sub-score).
- Cash flow +30.0/30.0
- ARV discount +15.0/15.0
- 1% rule +10.0/10.0
- DSCR +10.0/10.0
- Livability +3.3/5.0
- Rent growth +2.5/5.0
- Schools +2.5/10.0
- Condition / age +2.5/5.0
- Appreciation +0.0/10.0
$125,000
🖨 Deal sheet 📄 Offer letter ✓ Due diligence
Multi-family units
County records classify this as Multi-Family (2-4 Unit). Listing-text estimate: 1 unit. estimate disagrees with records
Listing remarks
Attention investors! This double block property is fully rented and ready for a new owner. Current owner did update the kitchen and bath on one side. This is a fantastic chance to own a two-unit building at an attractive price, with minimal maintenance required inside. Don't miss out!
Key facts
- Two-unit building
- Minimal maintenance
- Updated bath
Tags
Property features AI
Exterior
- Utilities: Public water; Public sewer
- Home design: Multi-family residential income property
- Construction: Aluminum siding
- Exterior features: Residential zoning
Interior
- Heating & cooling: Natural gas heating
- Interior features: Gas water heater; Has basement with dirt floor
Neighborhood map
What this means for you Summary
Snapshot
- This is a 4-bed/2.0-bath multifamily listed at $125k.
Deal economics
- At list price, monthly cash flow is $1k ($12k/yr) — positive.
- The deal already cash-flows at list — no discount required.
- Meets the 1% rule at list price ($2k rent vs $125k).
- Recommended offer: $123k (1.5% below list) — sets the bar for market timing.
- Cap rate 16.6% vs local median 8.3% in Plymouth — top-decile yield for the area; either an underpriced asset or a hidden risk that comps aren't pricing in. Stress-test before assuming the spread holds.
Location & tenants
- Location reads 66/100 on livability (#1,068 in PA) — a middle-class / working-renter tenant base. Strengths: cost of living A+, health & safety A+, housing B+; Watch: employment D, crime F, amenities F.
- Wyoming Valley West SD (suburban): math 18% / reading 42% proficiency, ranked #445 of 539 in PA (top 83%) — families likely to look elsewhere, expect single-tenant / working-renter base with shorter leases.
- Market conditions: 61 active listings in the ZIP; 11 comparable units currently listed for rent nearby; rentals at typical pace (median 21d on market — plan ~3-4 weeks tenant-placement turnaround); 45% of comp listings sitting > 30 days — soft ceiling on asking rent; 349 units permitted in Luzerne County in 2024 (16 in 5+ unit buildings).
Forward outlook
- Local home prices are declining (-3.0%/yr); year-one equity from $864 of loan paydown is wiped out by about $4k of value loss. Plan a longer hold.
- Luzerne County population projected at +4% by 2050 — modest demand growth; plan on rents tracking national, not racing it.
- At projected returns (-3.0% appreciation + 3.0% rent growth), your $35k cash investment doubles in ~4 years — after that, you're playing with house money.
Negotiation context
- It's been on market 19 days — a 2% lower offer ($123k) is reasonable based on typical stale-listing flexibility.
- 3 sale attempts; this cycle's ask has dropped $15k (11%) from the opening price — seller is motivated, your offer sets the floor, not the list.
- Current owner paid $40k; list at $125k implies a 212% gain — meaningful room to come down on a strong offer.
Risks & watch-outs
- Watch-outs: flood insurance adds $66/mo; built in 1940 — expect roof / HVAC / electrical / plumbing capex.
- Climate carrying-cost: severe flood risk — expect insurance premiums to compound above CPI over the hold.
Questions for the listing agent
- Built in 1940 — when were the roof, HVAC, electrical panel, plumbing, and water heater last replaced?
- What's the actual annual flood-insurance premium (NFIP or private), and is the property in a SFHA with mandatory coverage?
- Is there a deadline driving the sale (1031 exchange, divorce, estate, relocation)? That informs how much negotiation room exists.
- Crime grade is F in this area — have there been break-ins, vandalism, or insurance claims at this property in the last 3 years? What carrier currently insures it and at what premium?
- What's the average days-on-market for RENTAL listings here right now (not sales)? A rising rental-DOM trend means longer vacancies and softer asking-rent achievability than the comps imply.
- What's the recent tenant-quality profile in this submarket — average credit score on applications, eviction rate, late-payment / NSF rate, and stable-employment percentage? A property-management company in the area should have these aggregated.
- How much new apartment / multifamily construction is in the pipeline within 1–3 miles? Heavy new supply (>2% of stock underway) typically softens rents 12–24 months out; light construction supports rent growth.
Investment metrics
- 1% rule
- 1.96% ✓
- Cap rate
- 16.63%
- Cash-on-cash
- 36.93%
- DSCR
- 2.64
- GRM
- 4.3
CMA / ARV
- ARV (median comp)
- $152,286
- List price
- $125,000
- Delta
- -17.92%
- Verdict
- UNDERPRICED
- Comps
- 20 within 1.0 mi
Show comp detail 2 sales within ~0.75 mi
| Address | Dist | Beds/Ba | Sqft | Sold | Price | $/sf | Match |
|---|---|---|---|---|---|---|---|
| 131 Center Ave | 0.34mi | 4/2.0 | 2,000 (+0%) | 11mo | $190,000 | $95 | 74 |
| 133-135 High St | 0.23mi | 5/3.0 (+1) | 2,128 (+7%) | 7mo | $195,000 | $92 | 64 |
Match score weights: distance 35% · size 25% · config 20% · recency 20%. Top-matched comps best support the ARV.
Projected returns pro-forma
-3.0% appreciation · 3.0% rent growth · sell at horizon
- IRR
- 30.2%
- Equity multiple
- 2.26×
- Total profit
- $44,195
- Equity at exit
- $18,638
- IRR
- 37.4%
- Equity multiple
- 4.48×
- Total profit
- $121,674
- Equity at exit
- $10,808
Cash invested: $35,000 (down + closing). Projections, not guarantees.
Landlord ↔ Tenant lean methodology
- Overall (STATE)
- 62 Landlord-Friendly
- State Pennsylvania
- 62 Landlord-Friendly · EVEN
- County
- — inherits STATE
- City
- — inherits STATE
ZIP-level market 18651
- Home prices YoY
- -11.5%
- Active inventory
- 61
- Price-to-rent
- 8.5×
Monthly cashflow live
- Estimated rent
- $2,445 high interval (Pro) →
- Mortgage (P&I)
- −$656
- Tax from tax record
- −$147 /mo · $1,760/yr
- Insurance
- −$52
- Flood insurance flood zone
- −$66 /mo · $798/yr
- HOA
- −$0
- Vacancy / Maint / Mgmt
- −$513
- Net cashflow
- $1,011
Break-even live
2-unit breakdown (identical units grouped — click to expand)
| Units | Beds | Baths | Est. rent |
|---|---|---|---|
| 2× units | 2 | 1 | $2,444 |
| #1 | 2 | 1 | $1,222 |
| #2 | 2 | 1 | $1,222 |
| Total (2 units) | $2,445 | ||
UW: 25.0% down · 7.5% · 30yr · 1.5% tax · 5.0% vac · 8.0% maint · 8.0% mgmt
Financing live
Cash to close
- Down payment
- $31,250
- Closing costs
- $3,750
- Reserves months
- —
- Total cash needed
- —
Loan-product check · same deal, 3 products live
Conventional
25% down · 7.5% · 30yr
- Down + closing
- —
- Monthly P&I
- —
- Monthly cashflow
- —
- DSCR
- —
- Eligible?
- —
Personal DTI + credit; lowest rate.
DSCR
20% down · 8.5% · 30yr
- Down + closing
- —
- Monthly P&I
- —
- Monthly cashflow
- —
- DSCR
- —
- Eligible?
- —
No personal income docs; deal must DSCR.
Hard money
10% down · 12.0% · 12mo
- Down + closing
- —
- Monthly P&I
- —
- Monthly cashflow
- —
- DSCR
- —
- Eligible?
- —
Short-term bridge; refi at stabilization.
Rent comps 11 comps
| Address | Beds | Baths | Sqft | Rent | $/sqft | DOM | Units | Dist |
|---|---|---|---|---|---|---|---|---|
| 48 E Shawnee Ave Plymouth, PA | 3.0 | 1.0 | 1500 | $1,250 | $0.83 | 13d | 1 | 0.34mi |
| 210-212 Center Ave Plymouth, PA | 3.0 | 1.0 | 1300 | $1,200 | $0.92 | 44d | 1 | 0.45mi |
| 535 W State St Plymouth, PA | 3.0 | 1.0 | 1600 | $1,500 | $0.94 | 44d | 1 | 0.79mi |
| 463 2nd St Plymouth, PA | 3.0 | 1.0 | 1250 | $1,500 | $1.20 | 44d | 1 | 0.94mi |
| 134 Blair St Plymouth, PA | 3.0 | 1.0 | 1300 | $1,300 | $1.00 | 21d | 1 | 0.98mi |
| 29 Franklin St Plymouth, PA | 3.0 | 1.0 | 1426 | $1,800 | $1.26 | 13d | 1 | 1.01mi |
| 657 W Main St Plymouth, PA | 3.0 | 1.0 | 1600 | $1,700 | $1.06 | 13d | 1 | 1.08mi |
| 121 Oak St Unit 1 Wilkes-Barre, PA | 3.0 | 1.0 | 1960 | $1,550 | $0.79 | 13d | 1 | 1.21mi |
| 27 Oak St Wilkes Barre, PA | 3.0 | 1.5 | 1500 | $1,700 | $1.13 | 44d | 1 | 1.37mi |
| 342 Horton St Wilkes Barre, PA | 3.0 | 1.5 | 1472 | $1,650 | $1.12 | 13d | 1 | 1.38mi |
| 1259 Sively St Wilkes-Barre, PA | 3.0 | 1.0 | 1232 | $1,550 | $1.26 | 44d | 1 | 1.50mi |
Listing history 14 events
-
2026-06-18days on market $125,000 Active 19 DOM
-
2026-06-17days on market $125,000 Active 18 DOM
-
2026-06-16days on market $125,000 Active 17 DOM
-
2026-06-15pricestatus $125,000 Active 16 DOM
-
2026-06-09status $140,000 Pending 16 DOM
-
2026-06-08days on market $140,000 Active 16 DOM
-
2026-06-07days on market $140,000 Active 15 DOM
-
2026-06-05days on market $140,000 Active 12 DOM
-
2026-06-02days on market $140,000 Active 10 DOM
-
2026-06-01days on market $140,000 Active 9 DOM
-
2026-05-31days on market $140,000 Active 8 DOM
-
2026-05-30days on market $140,000 Active 7 DOM
-
2026-05-14$140,000 Active 285-char remark
-
2006-09-28soldstatus $40,000
ⓘ Source: listings_history table (triggers on properties + properties_extension) + one-shot
backfill from property_details.listing_events for pre-trigger history.
Tax reassessment forecast PA · Partial reset (capped growth)
- Current annual tax
- $1,760 · $147/mo
- Projected year-2 tax
- $1,868 · $156/mo
- Expected delta
- +$107/yr (+$9/mo · 6.1%)
ⓘ Screening estimate from a state-policy table — verify with the county assessor before closing.
Climate risk First Street
- Flood 8/10 Severe FEMA zone X · 99% chance over 30 yrs
- Wildfire 3/10 Moderate
- Heat 4/10 Moderate 7 d/yr ≥97°F today · 17 d/yr by 30 yrs out
- Wind 3/10 Moderate 5% chance of damaging wind over 30 yrs
- Air quality 2/10 Low 1 unhealthy d/yr today · 2 by 30 yrs out
Nearby sold comps map
Loading sold comps map…
Walkable amenities ~0.75 mi
Loading nearby amenities…
Taxation est. · year 1
- Rental income
- $29,340
- − Mortgage interest
- −$7,002
- − Property taxes
- −$1,760
- − Insurance
- −$1,422
- − Repairs & maintenance
- −$2,347
- − Management
- −$2,347
- − Depreciation
- −$3,636
- Taxable income
- $10,825
- Est. tax owed @ 24.0%
- −$2,598
- After-tax cash flow
- $9,532/yr
For passive investors: Depreciation is non-cash, so a rental often shows a tax loss while cash-flowing — sheltering income. Rental losses are passive: they offset passive income freely, and up to $25,000/yr can offset ordinary (W-2) income if you actively participate and your MAGI is under $100k (phasing out to $0 by $150k); unused losses carry forward. On sale, claimed depreciation is recaptured at up to 25%, and gains may owe capital-gains tax (a 1031 exchange can defer both). Figures are a year-1 estimate at your 24.0% rate — not tax advice; consult a CPA.
Schools (NCES district)
- District
- Wyoming Valley West SD
- NCES district ID
- 4225950
- Math proficiency
- 18% ▼ -11.00%
- Reading proficiency
- 42% ▼ -12.00%
- Median HH income
- $42,437
- Composite
- 25.38/100
- National rank
- #7470
- State rank
- #445 of 539 in PA
Livability — Plymouth
- Score
- 66/100
- State rank
- #1068
- US rank
- #12056
Category grades
Schools grade is shown separately in the Schools card above.
Census & demographics
- Census place
- Plymouth, PA
- Population (ZIP)
- 8,672
Population outlook (Luzerne County) Hauer SSP2
- Today (2025)
- 319,505 people
- By 2030
- 319,943 · +0.1%
- By 2040
- 322,643 · +1.0%
- By 2050
- 330,817 · +3.5%
- By 2075
- 379,145 · +18.7%
- By 2100
- 431,908 · +35.2%
Race, ethnicity, and origin ACS 2023
- Neighborhood character
- Predominantly White (82%)
- Race & ethnicity
- White 82% Hispanic / Latino 10% Black 5% Two or more races 4%
- Hispanic origin (detail)
- Mexican 3% Dominican 5%
- Common ancestry
- Romanian 19% Scotch-Irish 2% Iranian 2%
- Foreign-born
- 5% · Canada
- Languages at home
- 91% English-only · Spanish 7% Other Indo-European 1%
Political lean MEDSL · Luzerne
- 2024 margin
- R (+19.2) · D 40.0% · R 59.2%
- 2008→2024 swing
- -27.6pp toward R · 2008: 8.4pp · 2024: -19.2pp
- All cycles
- 2024: R+19.2 2020: R+14.4 2016: R+19.6 2012: D+4.8 2008: D+8.4
Not yet ingested
- Civics
- —
Market trends
- HPI YoY
- ▼ -29.78%
- Current HPI
- 229.6791
- Rent YoY
- —
- Metro
- —
- State GDP YoY
- ▲ 1.68%
- F500 in state
- 34
Industry mix (Fortune 500 HQ in PA)
| Industry | F500 HQs | Revenue |
|---|---|---|
| Healthcare | 2 | $309B |
|
||
| Insurance | 2 | $27B |
|
||
| Telecommunications / Media | 1 | $124B |
|
||
| Industrial Distribution | 1 | $22B |
|
||
| Financial Services | 1 | $20B |
|
||
| Chemicals / Materials | 1 | $18B |
|
||
Price history
+212.5% since first listed7 events — show timeline
- 2026-06-15 Price Changed $125,000 LCAR
- 2026-06-15 Relisted — LCAR
- 2026-06-09 Pending — LCAR
- 2026-05-28 Relisted — LCAR
- 2026-05-19 Pending — LCAR
- 2026-05-14 Listed $140,000 LCAR
- 2006-09-28 Sold (Public Records) $40,000 Public Records
Property tax history
+2.2%/yrLatest (2026): $1,760 · +1.8% YoY. Source: county tax records.
Cash-flow waterfall
monthlySold comps — $/sqft
last 12 mo · ≤1 miLoading sold comps…