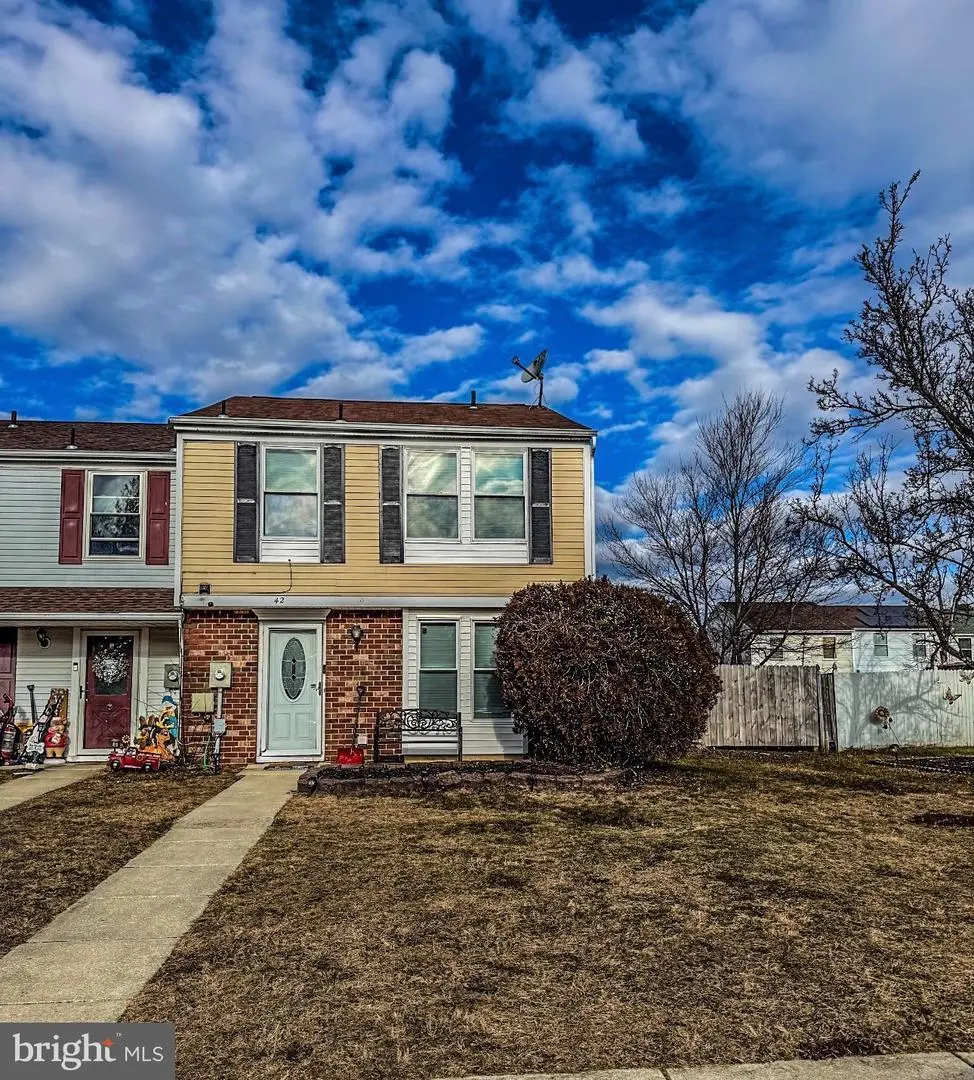
42 Victoria Manor Ct
Sicklerville, NJ 08081
$225,000D
3 bd · 1.5 ba ·
1,160 sqft ·
Built 1986
· SingleFamily
· Pending
· 17 DOM
Cashflow @ list (25.0% down · 7.5%)
Estimated rent
$2,347/mo
Mortgage (P&I)
−$1,180
Tax + insurance
−$416
HOA
−$105
Vac / Maint / Mgmt
−$493
Net cashflow
$154/mo
Annual
$1,845/yr
Cap rate
7.11%
Cash-on-cash
2.93%
DSCR
1.13
1% rule
1.04%
Cash to close
$63,000
Investor read
- This is a 3-bed/1.5-bath single-family listed at $225k.
- At list price, monthly cash flow is $154 ($2k/yr) — positive.
- The deal already cash-flows at list — no discount required.
- Meets the 1% rule at list price ($2k rent vs $225k).
- It's been on market 17 days — a 2% lower offer ($222k) is reasonable based on typical stale-listing flexibility.
- Recommended offer: $222k (1.5% below list) — sets the bar for market timing.
- Local home prices are declining (-3.0%/yr); year-one equity from $2k of loan paydown is wiped out by about $7k of value loss. Plan a longer hold.
- Location reads: area grade D — affects rentability + tenant quality, not the cash-flow math above.
- Winslow Township School District (suburban): math 11% / reading 36% proficiency, ranked #387 of 472 in NJ (top 82%) — low school quality limits family demand, transient renter base, plan for 1-2y turnover.
- Zoned schools: Winslow Township Elementary School One (math 2% / reading 17%, grade F, #1,235 of 1,303 statewide, top 96%, 356 students, 59% FRL); Winslow Township Middle School (math 14% / reading 42%, grade F, #335 of 431 statewide, top 79%, 764 students, 46% FRL); Winslow Township High School (math 10% / reading 36%, grade F, #337 of 399 statewide, top 85%, 1,273 students, 42% FRL).
- Market conditions: Rents rising (+3.4%/yr); 336 active listings in the ZIP; 11 comparable units currently listed for rent nearby; rentals leasing fast (median 5d on market — plan ~1-2 weeks tenant-placement turnaround); solid renter incomes; 1,018 units permitted in Camden County in 2024 (509 in 5+ unit buildings).
- Camden County population projected to shrink 8% by 2050 — rents likely to lag national; underwrite the cash flow, not the appreciation.
- 5 sale attempts since 24y ago with the ask held roughly flat each time — persistent listings suggest the price (not the market) is what's stuck; bring a comps-based counter.
- Climate carrying-cost: major wind risk, 63% chance of damaging wind over 30y; extreme-heat days projected 7→14/yr by 2055 (HVAC capex compounding) — expect insurance premiums to compound above CPI over the hold.
- Cap rate 7.1% vs local median 4.8% in Sicklerville — top-decile yield for the area; either an underpriced asset or a hidden risk that comps aren't pricing in. Stress-test before assuming the spread holds.
Questions for listing agent
- What does the HOA fee cover, when was the last increase, and are there any pending special assessments or reserve-fund shortfalls?
- Is there a deadline driving the sale (1031 exchange, divorce, estate, relocation)? That informs how much negotiation room exists.
- The area grade is low — what's the realistic commute time and amenity access for the typical tenant pool here? Any planned neighborhood developments (good or bad) we should know about?
- What's the average days-on-market for RENTAL listings here right now (not sales)? A rising rental-DOM trend means longer vacancies and softer asking-rent achievability than the comps imply.
- What's the recent tenant-quality profile in this submarket — average credit score on applications, eviction rate, late-payment / NSF rate, and stable-employment percentage? A property-management company in the area should have these aggregated.
- How much new for-sale + rental construction is in the pipeline within 1–3 miles? Heavy new supply typically softens prices + rents 12–24 months out; constrained supply supports both.
CashFlowRE · CFR-KMY83N6W15K0WS
· Data 1 day ago
cashflowre.app · 2026-05-29