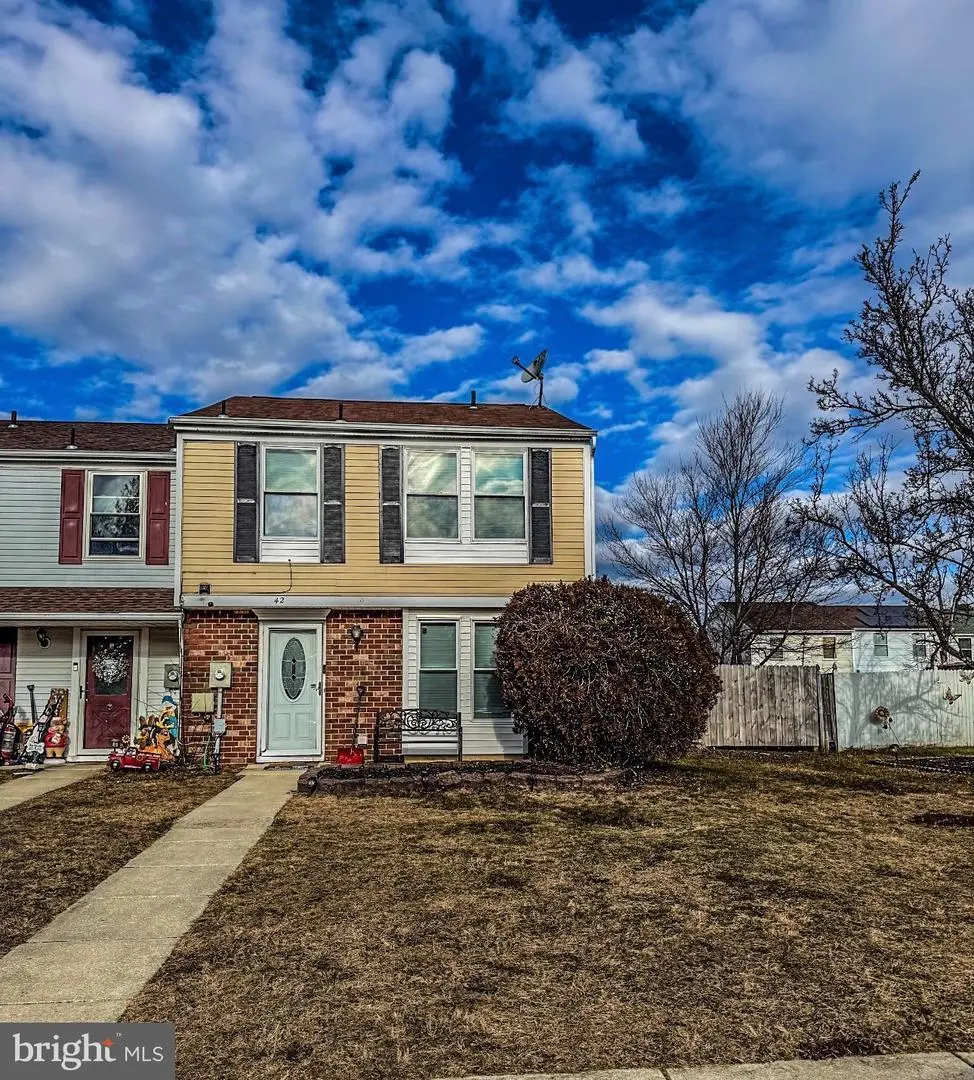
42 Victoria Manor Ct · Sicklerville, NJ
Flood risk 1/10 · Minimal
- FEMA flood zone
- X (unshaded)
- Chance of flooding over 30 yrs
- 0.0%
- Est. flood insurance / yr
- $507 – $1,088
Fire risk 4/10 · Minor
- Est. fire insurance / yr
- $526 – $976
Heat risk 7/10 · Major
- Hot days now (above 104°F)
- 7 days/yr
- Hot days in 30 yrs
- 14 days/yr
Wind risk 6/10 · Moderate
- Chance of severe wind over 30 yrs
- 63.0%
Air-quality risk 3/10 · Minor
- Unhealthy air days now
- 2 days/yr
- Unhealthy air days in 30 yrs
- 4 days/yr
Risk factors via First Street. Map © Google.
Why this score? — see what drove the D grade
The composite is a weighted blend of 9 inputs, each scored 0–100. Each bar is that input's sub-score; the figure is the points it added to the 100-point composite (weight × sub-score).
- Cash flow +17.0/30.0
- 1% rule +5.4/10.0
- DSCR +5.3/10.0
- ARV discount +3.8/15.0
- Rent growth +3.4/5.0
- Livability +2.5/5.0
- Condition / age +2.5/5.0
- Schools +2.3/10.0
- Appreciation +0.0/10.0
$225,000
🖨 Deal sheet (PDF) 📄 Offer letter ✓ Due diligence
Listing remarks MLS
This is a listing for a 3BR, 1.5 BA Townhome in Sicklerville, NJ. Full remarks to come soon.
Key facts
- $105 HOA
- Parking
- Built 1986
Property features AI
Finance
- Other: Property manager present
- HOA & community: Monthly HOA fee of $105; HOA covers common area maintenance, snow removal, trash, and lawn maintenance
Exterior
- Parking: Parking lot with 1 space (total garage and parking spaces: 1)
- Utilities: Public water; No septic system; Electric available; Cable TV available; Cable internet service; Electric hot water
- Home design: End of row townhouse; Fee simple ownership; Very good condition; Building not winterized
- Construction: Concrete construction; Permanent foundation; Patio(s) noted as outdoor living structure; Above grade and below grade structures
- Exterior features: Wood fencing; Lot dimensions approximately 42 x 100; Not in a federal flood zone
Interior
- Kitchen: Stainless steel appliances; Stove; Microwave; Dishwasher
- Bedrooms: Three bedrooms on the main level
- Flooring: Hardwood floors
- Bathrooms: One full bathroom; One half bathroom
- Heating & cooling: Forced air heating (electric); Central air conditioning (electric)
- Interior features: French doors; Exterior lighting; Play area; Patio(s)
- Laundry & utility: Main-floor laundry
Neighborhood map
What this means for you Summary
Snapshot
- This is a 3-bed/1.5-bath single-family listed at $225k.
Deal economics
- At list price, monthly cash flow is $154 ($2k/yr) — positive.
- The deal already cash-flows at list — no discount required.
- Meets the 1% rule at list price ($2k rent vs $225k).
- Recommended offer: $222k (1.5% below list) — sets the bar for market timing.
- Cap rate 7.1% vs local median 4.7% in Sicklerville — top-decile yield for the area; either an underpriced asset or a hidden risk that comps aren't pricing in. Stress-test before assuming the spread holds.
Location & tenants
- Location reads: area grade D — affects rentability + tenant quality, not the cash-flow math above.
- Winslow Township School District (suburban): math 11% / reading 36% proficiency, ranked #387 of 472 in NJ (top 82%) — low school quality limits family demand, transient renter base, plan for 1-2y turnover.
- Zoned schools: Winslow Township Elementary School One (math 2% / reading 17%, grade F, #1,235 of 1,303 statewide, top 96%, 356 students, 59% FRL); Winslow Township Middle School (math 14% / reading 42%, grade F, #335 of 431 statewide, top 79%, 764 students, 46% FRL); Winslow Township High School (math 10% / reading 36%, grade F, #337 of 399 statewide, top 85%, 1,273 students, 42% FRL).
- Market conditions: Rents rising (+3.4%/yr); 335 active listings in the ZIP; 11 comparable units currently listed for rent nearby; rentals leasing fast (median 5d on market — plan ~1-2 weeks tenant-placement turnaround); solid renter incomes; 1,018 units permitted in Camden County in 2024 (509 in 5+ unit buildings).
Forward outlook
- Local home prices are declining (-3.0%/yr); year-one equity from $2k of loan paydown is wiped out by about $7k of value loss. Plan a longer hold.
- Camden County population projected to shrink 8% by 2050 — rents likely to lag national; underwrite the cash flow, not the appreciation.
Negotiation context
- It's been on market 17 days — a 2% lower offer ($222k) is reasonable based on typical stale-listing flexibility.
- 5 sale attempts since 24y ago with the ask held roughly flat each time — persistent listings suggest the price (not the market) is what's stuck; bring a comps-based counter.
Risks & watch-outs
- Climate carrying-cost: major wind risk, 63% chance of damaging wind over 30y; extreme-heat days projected 7→14/yr by 2055 (HVAC capex compounding) — expect insurance premiums to compound above CPI over the hold.
Questions for the listing agent
- What does the HOA fee cover, when was the last increase, and are there any pending special assessments or reserve-fund shortfalls?
- Is there a deadline driving the sale (1031 exchange, divorce, estate, relocation)? That informs how much negotiation room exists.
- The area grade is low — what's the realistic commute time and amenity access for the typical tenant pool here? Any planned neighborhood developments (good or bad) we should know about?
- What's the average days-on-market for RENTAL listings here right now (not sales)? A rising rental-DOM trend means longer vacancies and softer asking-rent achievability than the comps imply.
- What's the recent tenant-quality profile in this submarket — average credit score on applications, eviction rate, late-payment / NSF rate, and stable-employment percentage? A property-management company in the area should have these aggregated.
- How much new for-sale + rental construction is in the pipeline within 1–3 miles? Heavy new supply typically softens prices + rents 12–24 months out; constrained supply supports both.
Investment metrics
- 1% rule
- 1.04% ✓
- Cap rate
- 7.11%
- Cash-on-cash
- 2.93%
- DSCR
- 1.13
- GRM
- 8.0
CMA / ARV
- ARV (median comp)
- $207,764
- List price
- $225,000
- Delta
- 8.30%
- Verdict
- FAIR
- Comps
- 20 within 1.0 mi
Show comp detail 6 sales within ~0.75 mi
| Address | Dist | Beds/Ba | Sqft | Sold | Price | $/sf | Match |
|---|---|---|---|---|---|---|---|
| 55 Victoria Manor Ct | 0.05mi | 3/1.0 | 1,120 (-3%) | 21mo | $207,000 | $185 | 73 |
| 35 Eastmont Ln | 0.14mi | 3/1.0 | 1,006 (-13%) | 0mo | $355,000 | $353 | 69 |
| 42 Eastmont Ln | 0.17mi | 3/1.0 | 1,006 (-13%) | 2mo | $315,000 | $313 | 66 |
| 15 Eastmont Ln | 0.23mi | 4/2.0 (+1) | 1,177 (+2%) | 21mo | $345,000 | $293 | 62 |
| 10 Eden Hollow Ln | 0.32mi | 4/1.0 (+1) | 1,059 (-9%) | 9mo | $297,250 | $281 | 56 |
| 42 Penfield Ln | 0.62mi | 3/1.0 | 1,279 (+10%) | 17mo | $315,000 | $246 | 38 |
Match score weights: distance 35% · size 25% · config 20% · recency 20%. Top-matched comps best support the ARV.
Projected returns pro-forma
-3.0% appreciation · 3.41% rent growth · sell at horizon
- IRR
- -11.1%
- Equity multiple
- 0.59×
- Total profit
- $-25,571
- Equity at exit
- $33,548
- IRR
- -1.2%
- Equity multiple
- 0.92×
- Total profit
- $-5,128
- Equity at exit
- $19,454
Cash invested: $63,000 (down + closing). Projections, not guarantees.
Landlord ↔ Tenant lean methodology
- Overall (STATE)
- 21 Tenant-Leaning
- State New Jersey
- 21 Tenant-Leaning · D+6
- County
- — inherits STATE
- City
- — inherits STATE
ZIP-level market 08081
- Rents YoY
- 3.4%
- Active inventory
- 335
- Price-to-rent
- 8.0×
Monthly cashflow live
- Estimated rent
- $2,347 high interval (Pro) →
- Mortgage (P&I)
- −$1,180
- Tax from tax record
- −$322 /mo · $3,863/yr
- Insurance
- −$94
- HOA
- −$105
- Vacancy / Maint / Mgmt
- −$493
- Net cashflow
- $154
Break-even live
Sensitivity live
| Price | -10% $281 | -5% $217 | +0% $154 | +5% $90 | +10% $26 |
|---|---|---|---|---|---|
| Rent | -10% $-32 | -5% $61 | +0% $154 | +5% $246 | +10% $339 |
| Rate | -1.0pp $267 | -0.5pp $211 | base $154 | +0.5pp $95 | +1.0pp $36 |
UW: 25.0% down · 7.5% · 30yr · 1.5% tax · 5.0% vac · 8.0% maint · 8.0% mgmt
Financing live
Cash to close
- Down payment
- $56,250
- Closing costs
- $6,750
- Reserves months
- —
- Total cash needed
- —
Loan-product check · same deal, 3 products live
Conventional
25% down · 7.5% · 30yr
- Down + closing
- —
- Monthly P&I
- —
- Monthly cashflow
- —
- DSCR
- —
- Eligible?
- —
Personal DTI + credit; lowest rate.
DSCR
20% down · 8.5% · 30yr
- Down + closing
- —
- Monthly P&I
- —
- Monthly cashflow
- —
- DSCR
- —
- Eligible?
- —
No personal income docs; deal must DSCR.
Hard money
10% down · 12.0% · 12mo
- Down + closing
- —
- Monthly P&I
- —
- Monthly cashflow
- —
- DSCR
- —
- Eligible?
- —
Short-term bridge; refi at stabilization.
Rent comps 11 comps
| Address | Beds | Baths | Sqft | Rent | $/sqft | DOM | Units | Dist |
|---|---|---|---|---|---|---|---|---|
| 27 Villanova Ct Sicklerville, NJ | 3.0 | 1.5 | 1280 | $2,300 | $1.80 | 4d | 1 | 0.11mi |
| 8 Vernon Ct Sicklerville, NJ | 3.0 | 1.5 | 1300 | $1,900 | $1.46 | 5d | 1 | 0.13mi |
| 4 Milstone Ct Sicklerville, NJ | 3.0 | 1.5 | 1462 | $2,400 | $1.64 | 3d | 1 | 0.22mi |
| 28 Melwood Ct Sicklerville, NJ | 3.0 | 1.5 | 1370 | $2,500 | $1.82 | 17d | 1 | 0.27mi |
| 28 Magnolia Ct Sicklerville, NJ | 3.0 | 1.5 | 1450 | $2,000 | $1.38 | 45d | 1 | 0.28mi |
| 46 Magnolia Ct Sicklerville, NJ | 2.0 | 1.5 | 1370 | $2,200 | $1.61 | 4d | 1 | 0.30mi |
| 25 Memphis Ct Sicklerville, NJ | 3.0 | 1.5 | 1450 | $2,000 | $1.38 | 20d | 1 | 0.31mi |
| 9 Marcia Ct Unit 9 Sicklerville, NJ | 3.0 | 1.5 | 1462 | $2,000 | $1.37 | 0d | 1 | 0.34mi |
| 16 High Meadows Dr Sicklerville, NJ | 3.0 | 1.5 | 1353 | $2,600 | $1.92 | 45d | 1 | 0.48mi |
| 110 High Meadows Dr Sicklerville, NJ | 3.0 | 1.5 | 1408 | $2,400 | $1.70 | 45d | 1 | 0.62mi |
| 3 Lawrence Ct Sicklerville, NJ | 2.0 | 1.0 | 968 | $1,850 | $1.91 | 0d | 1 | 0.86mi |
HOA detail
- Monthly dues
- $105 · $1,260/yr
Listing history 18 events
-
2026-05-13status Pending 714-char remark
-
2026-04-26$225,000 Active 714-char remark
-
2026-03-10status Pending
-
2026-03-10historical
-
2026-03-06historical Active Under Contract
-
2026-02-06$225,000 Active
-
2026-02-02historical
-
2024-01-24soldstatus $220,000
-
2023-12-15soldstatus $220,000 Closed
Show marketing remark (92 chars)
This is a listing for a 3BR, 1.5 BA Townhome in Sicklerville, NJ. Full remarks to come soon.
-
2023-11-09status Pending
Show marketing remark (92 chars)
This is a listing for a 3BR, 1.5 BA Townhome in Sicklerville, NJ. Full remarks to come soon.
-
2023-11-03$209,900 Active
Show marketing remark (92 chars)
This is a listing for a 3BR, 1.5 BA Townhome in Sicklerville, NJ. Full remarks to come soon.
-
2023-09-17historical
-
2023-03-20$200,000 Active
-
2003-07-02soldstatus $74,000
-
2003-05-30soldstatus $74,000
-
2002-12-02$74,000
-
1990-08-02soldstatus $78,000
-
1986-12-29soldstatus $60,600
ⓘ Source: listings_history table (triggers on properties + properties_extension) + one-shot
backfill from property_details.listing_events for pre-trigger history.
Tax reassessment forecast NJ · Partial reset (capped growth)
- Current annual tax
- $3,863 · $322/mo
- Projected year-2 tax
- $4,733 · $394/mo
- Expected delta
- +$870/yr (+$72/mo · 22.5%)
ⓘ Screening estimate from a state-policy table — verify with the county assessor before closing.
Climate risk First Street
- Flood 1/10 Low FEMA zone X (unshaded) · 0% chance over 30 yrs
- Wildfire 4/10 Moderate
- Heat 7/10 Severe 7 d/yr ≥104°F today · 14 d/yr by 30 yrs out
- Wind 6/10 Major 63% chance of damaging wind over 30 yrs
- Air quality 3/10 Moderate 2 unhealthy d/yr today · 4 by 30 yrs out
Nearby sold comps map
Loading sold comps map…
Walkable amenities ~0.75 mi
Loading nearby amenities…
Taxation est. · year 1
- Rental income
- $28,167
- − Mortgage interest
- −$12,603
- − Property taxes
- −$3,863
- − Insurance
- −$1,125
- − Repairs & maintenance
- −$2,253
- − Management
- −$2,253
- − HOA
- −$1,260
- − Depreciation
- −$6,545
- Taxable loss
- −$1,737
- Est. tax savings @ 24.0%
- +$417
- After-tax cash flow
- $2,262/yr
For passive investors: Depreciation is non-cash, so a rental often shows a tax loss while cash-flowing — sheltering income. Rental losses are passive: they offset passive income freely, and up to $25,000/yr can offset ordinary (W-2) income if you actively participate and your MAGI is under $100k (phasing out to $0 by $150k); unused losses carry forward. On sale, claimed depreciation is recaptured at up to 25%, and gains may owe capital-gains tax (a 1031 exchange can defer both). Figures are a year-1 estimate at your 24.0% rate — not tax advice; consult a CPA.
Schools (NCES district)
- District
- Winslow Township School District
- NCES district ID
- 3418060
- Math proficiency
- 11% ▼ -17.00%
- Reading proficiency
- 36% ▼ -5.00%
- Median HH income
- $70,254
- Composite
- 22.65/100
- National rank
- #8057
- State rank
- #387 of 472 in NJ
Livability — Sicklerville
No livability data for this city. (Only ~50 U.S. cities are tracked.)
Census & demographics
- Census place
- Sicklerville, NJ
- County
- Camden County · 407,624 people
- City population
- 50,264
- Metro
- Philadelphia-Camden-Wilmington, PA-NJ-DE-MD
- Population (ZIP)
- 50,264
- Household income
- $105,800
- Rent vs Own
- Severe rent burden
- 979.0
Population outlook (Camden County) Hauer SSP2
- Today (2025)
- 507,964 people
- By 2030
- 502,182 · -1.1%
- By 2040
- 485,602 · -4.4%
- By 2050
- 465,630 · -8.3%
- By 2075
- 419,986 · -17.3%
- By 2100
- 369,492 · -27.3%
Race, ethnicity, and origin ACS 2023
- Neighborhood character
- Diverse neighborhood (Simpson 0.65)
- Race & ethnicity
- White 47% Black 34% Two or more races 9% Hispanic / Latino 9% Asian 4%
- Hispanic origin (detail)
- Puerto Rican 5%
- Common ancestry
- Romanian 6% Slovak 2% Iranian 1%
- Foreign-born
- 8% · Canada, China, South Korea
- Languages at home
- 90% English-only · Spanish 4% Other Indo-European 1% Tagalog/Filipino 1%
Political lean MEDSL · Camden
- 2024 margin
- Strong D (+27.4) · D 63.0% · R 35.5% · Other 1.5%
- 2008→2024 swing
- -8.8pp toward R · 2008: 36.2pp · 2024: 27.4pp
- All cycles
- 2024: D+27.4 2020: D+33.5 2016: D+32.4 2012: D+36.6 2008: D+36.2
Not yet ingested
- Civics
- —
Market trends
- HPI YoY
- ▼ -176.48%
- Current HPI
- 303.1017
- Rent YoY
- ▲ 3.41%
- Metro
- Philadelphia-Camden-Wilmington, PA-NJ-DE-MD
- State GDP YoY
- ▲ 2.05%
- F500 in state
- 34
Industry mix (Fortune 500 HQ in NJ)
| Industry | F500 HQs | Revenue |
|---|---|---|
| Consumer Goods | 3 | $31B |
|
||
| Pharmaceuticals | 2 | $153B |
|
||
| Technology | 2 | $21B |
|
||
| Insurance | 2 | $20B |
|
||
| Healthcare | 2 | $19B |
|
||
| Financial Services | 1 | $70B |
|
||
Price history
+271.3% since first listed18 events — show timeline
- 2026-05-13 Pending — BRIGHT MLS
- 2026-04-26 Listed $225,000 BRIGHT MLS
- 2026-03-10 Pending — BRIGHT MLS
- 2026-03-10 Listing Removed — BRIGHT MLS
- 2026-03-06 Contingent — BRIGHT MLS
- 2026-02-06 Listed $225,000 BRIGHT MLS
- 2026-02-02 Coming Soon — BRIGHT MLS
- 2024-01-24 Sold (Public Records) $220,000 Public Records
- 2023-12-15 Sold (MLS) $220,000 BRIGHT MLS
- 2023-11-09 Pending — BRIGHT MLS
- 2023-11-03 Listed $209,900 BRIGHT MLS
- 2023-09-17 Listing Removed — BRIGHT MLS
- 2023-03-20 Listed $200,000 BRIGHT MLS
- 2003-07-02 Sold (Public Records) $74,000 Public Records
- 2003-05-30 Sold (MLS) $74,000 BRIGHT MLS
- 2002-12-02 Listed $74,000 BRIGHT MLS
- 1990-08-02 Sold (Public Records) $78,000 Public Records
- 1986-12-29 Sold (Public Records) $60,600 Public Records
Property tax history
+2.1%/yrLatest (2025): $3,863 · +1.9% YoY. Source: county tax records.
Cash-flow waterfall
monthlySold comps — $/sqft
last 12 mo · ≤1 miLoading sold comps…