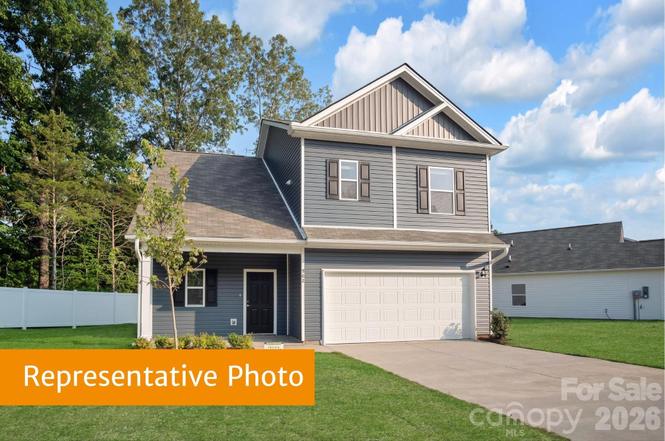
5667 Hagler Loop
Catawba, NC 28609
$280,025D
3 bd · 2.5 ba ·
1,650 sqft ·
Built 2026
· SingleFamily
· Active
· 5 DOM
Cashflow @ list (25.0% down · 7.5%)
Estimated rent
$2,350/mo
Mortgage (P&I)
−$1,468
Tax + insurance
−$467
HOA
−$0
Vac / Maint / Mgmt
−$494
Net cashflow
$-79/mo
Annual
$-944/yr
Cap rate
5.96%
Cash-on-cash
-1.20%
DSCR
0.95
1% rule
0.84%
Cash to close
$78,407
Investor read
- This is a 3-bed/2.5-bath single-family listed at $280k. Condition is rated excellent.
- At list price, monthly cash flow is $-79 ($-944/yr) — negative.
- To cash-flow at today's rent, offer at most $269k (4.1% below list).
- To meet the 1% rule (rent ≥ 1% of price), the offer needs to be $235k (16.1% below list).
- Only 5 days on market — expect competitive offers; lowballing is unlikely to land.
- Recommended offer: $235k (16.1% below list) — sets the bar for 1% rule.
- Local home prices are declining (-3.0%/yr); year-one equity from $2k of loan paydown is wiped out by about $8k of value loss. Plan a longer hold.
- Location reads 61/100 on livability (#494 in NC) — a middle-class / working-renter tenant base. Strengths: cost of living A+, housing A-, health & safety B; Watch: crime F, amenities F, commute F.
- Catawba County Schools (rural): math 54% / reading 51% proficiency, ranked #54 of 178 in NC (top 30%) — acceptable for families but not a draw, mixed tenant base, ~2y average lease.
- Zoned schools: Catawba Elementary School (math 38% / reading 34%, grade F, #812 of 1,410 statewide, top 58%, 404 students, 70% FRL); Bandys High (math 72% / reading 72%, grade B+, #107 of 535 statewide, top 21%, 864 students, 33% FRL).
- Market conditions: 92 active listings in the ZIP; 1 comparable units currently listed for rent nearby; 2,016 units permitted in Catawba County in 2024 (255 in 5+ unit buildings).
- Catawba County population projected to shrink 7% by 2050 — rents likely to lag national; underwrite the cash flow, not the appreciation.
- 2 sale attempts with the ask held roughly flat each time — persistent listings suggest the price (not the market) is what's stuck; bring a comps-based counter.
- Cap rate 6.0% vs local median 3.9% in Catawba — top-decile yield for the area; either an underpriced asset or a hidden risk that comps aren't pricing in. Stress-test before assuming the spread holds.
Questions for listing agent
- What do current leases actually rent for vs. the listed asking? Can we see a recent rent roll and the last 12 months of T-12 income?
- Is there a deadline driving the sale (1031 exchange, divorce, estate, relocation)? That informs how much negotiation room exists.
- Crime grade is F in this area — have there been break-ins, vandalism, or insurance claims at this property in the last 3 years? What carrier currently insures it and at what premium?
- The area grade is low — what's the realistic commute time and amenity access for the typical tenant pool here? Any planned neighborhood developments (good or bad) we should know about?
- What's the average days-on-market for RENTAL listings here right now (not sales)? A rising rental-DOM trend means longer vacancies and softer asking-rent achievability than the comps imply.
- What's the recent tenant-quality profile in this submarket — average credit score on applications, eviction rate, late-payment / NSF rate, and stable-employment percentage? A property-management company in the area should have these aggregated.
- How much new for-sale + rental construction is in the pipeline within 1–3 miles? Heavy new supply typically softens prices + rents 12–24 months out; constrained supply supports both.
CashFlowRE · CFR-KN3Q6JC7MPQJHK
· Data 2 days ago
cashflowre.app · 2026-05-29