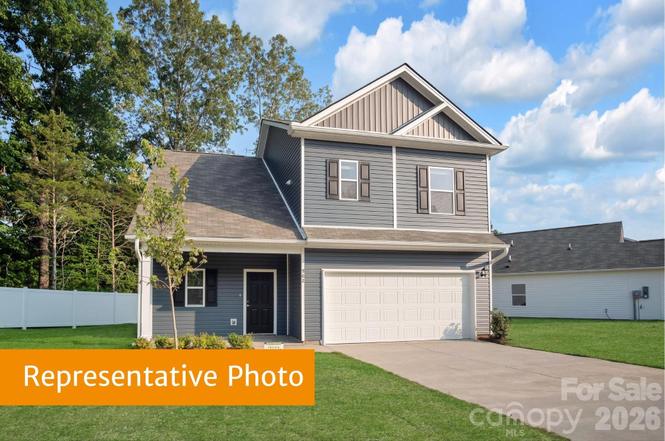
5667 Hagler Loop · Catawba, NC
Flood risk No data
- FEMA flood zone
- —
- Chance of flooding over 30 yrs
- —
- Est. flood insurance / yr
- —
Fire risk No data
- Est. fire insurance / yr
- —
Heat risk No data
- Hot days now (above threshold)
- —
- Hot days in 30 yrs
- —
Wind risk No data
- Chance of severe wind over 30 yrs
- —
Air-quality risk No data
- Unhealthy air days now
- —
- Unhealthy air days in 30 yrs
- —
Risk factors via First Street. Map © Google.
Why this score? — see what drove the D grade
The composite is a weighted blend of 9 inputs, each scored 0–100. Each bar is that input's sub-score; the figure is the points it added to the 100-point composite (weight × sub-score).
- Cash flow +11.8/30.0
- ARV discount +10.5/15.0
- Condition / age +5.0/5.0
- Schools +4.5/10.0
- DSCR +3.5/10.0
- 1% rule +3.4/10.0
- Livability +3.1/5.0
- Rent growth +2.5/5.0
- Appreciation +0.0/10.0
$280,025
🖨 Deal sheet 📄 Offer letter ✓ Due diligence
Listing remarks MLS
This proposed to-be-built Lawson plan (ready October 2026) offers the perfect opportunity to create a home tailored to your style, with the ability to select finishes and personalize the details that matter most to you. With a thoughtfully designed layout featuring 3 bedrooms and 2.5 bathrooms across 1,650 square feet, this home delivers both comfort and efficiency. The open-concept main living area provides a bright and inviting space for everyday living and entertaining, while well-sized bedrooms offer a cozy retreat. A 2-car garage adds convenience and extra storage. Take advantage of some of the most desirable homesites currently available, including premium corner lots and homesites that back to a tree line, offering added privacy and a peaceful natural backdrop. Located in the desirable Catawba Trace community, youll enjoy a serene setting with convenient access to Lake Norman, as well as nearby shopping, dining, and major roadwaysmaking daily life both relaxing and connected. Dont miss your chance to build and personalize your Lawson home while these sought-after homesites are still availablesecure yours today!
Key facts
- Premium corner lots
- Added privacy
- Nearby shopping
Tags
Property features AI
Finance
- Other: Property is proposed/development status: Proposed; Zoning: Residential
- HOA & community: Homeowners association required; Community sidewalks; Street lights; Architectural review restriction
Exterior
- Parking: Attached front-facing garage; 2-car garage; Driveway; Main level garage
- Security: Carbon monoxide detector(s)
- Utilities: City water; Public sewer; Cable available; Fiber optics available
- Home design: Single family residence; New construction (proposed completion: 2026-10-30); Two levels; Site-built; Model: The Lawson; Builder: Smith Douglas Homes; Accessibility with two or more access exits
- Construction: Vinyl exterior; Slab foundation
- Exterior features: Front porch; Patio; Concrete and paved roads; Road dedication to public use pending acceptance
Interior
- Kitchen: Dishwasher; Disposal; Electric oven; Electric range; Exhaust fan; Microwave; Plumbed for ice maker; Self-cleaning oven
- Bedrooms: 3 bedrooms (all on upper level)
- Flooring: Carpet; Vinyl
- Bathrooms: 2 full bathrooms (upper level); 1 half bathroom (main level)
- Heating & cooling: Electric heating; Electric cooling
- Interior features: Breakfast bar; Kitchen island; Open floorplan; Pantry; Walk-in closet(s); Insulated windows; Insulated door(s); 9 total rooms
- Laundry & utility: Washer hookup on main level
Neighborhood map
What this means for you Summary
Snapshot
- This is a 3-bed/2.5-bath single-family listed at $280k. Condition is rated excellent.
Deal economics
- At list price, monthly cash flow is $-79 ($-944/yr) — negative.
- To cash-flow at today's rent, offer at most $269k (4.1% below list).
- To meet the 1% rule (rent ≥ 1% of price), the offer needs to be $235k (16.1% below list).
- Recommended offer: $235k (16.1% below list) — sets the bar for 1% rule.
- Cap rate 6.0% vs local median 3.9% in Catawba — top-decile yield for the area; either an underpriced asset or a hidden risk that comps aren't pricing in. Stress-test before assuming the spread holds.
Location & tenants
- Location reads 61/100 on livability (#494 in NC) — a middle-class / working-renter tenant base. Strengths: cost of living A+, housing A-, health & safety B; Watch: crime F, amenities F, commute F.
- Catawba County Schools (rural): math 54% / reading 51% proficiency, ranked #54 of 178 in NC (top 30%) — acceptable for families but not a draw, mixed tenant base, ~2y average lease.
- Zoned schools: Catawba Elementary School (math 38% / reading 34%, grade F, #812 of 1,410 statewide, top 58%, 404 students, 70% FRL); Bandys High (math 72% / reading 72%, grade B+, #107 of 535 statewide, top 21%, 864 students, 33% FRL).
- Market conditions: 92 active listings in the ZIP; 1 comparable units currently listed for rent nearby; 2,016 units permitted in Catawba County in 2024 (255 in 5+ unit buildings).
Forward outlook
- Local home prices are declining (-3.0%/yr); year-one equity from $2k of loan paydown is wiped out by about $8k of value loss. Plan a longer hold.
- Catawba County population projected to shrink 7% by 2050 — rents likely to lag national; underwrite the cash flow, not the appreciation.
Negotiation context
- Only 5 days on market — expect competitive offers; lowballing is unlikely to land.
- 2 sale attempts with the ask held roughly flat each time — persistent listings suggest the price (not the market) is what's stuck; bring a comps-based counter.
Questions for the listing agent
- What do current leases actually rent for vs. the listed asking? Can we see a recent rent roll and the last 12 months of T-12 income?
- Is there a deadline driving the sale (1031 exchange, divorce, estate, relocation)? That informs how much negotiation room exists.
- Crime grade is F in this area — have there been break-ins, vandalism, or insurance claims at this property in the last 3 years? What carrier currently insures it and at what premium?
- The area grade is low — what's the realistic commute time and amenity access for the typical tenant pool here? Any planned neighborhood developments (good or bad) we should know about?
- What's the average days-on-market for RENTAL listings here right now (not sales)? A rising rental-DOM trend means longer vacancies and softer asking-rent achievability than the comps imply.
- What's the recent tenant-quality profile in this submarket — average credit score on applications, eviction rate, late-payment / NSF rate, and stable-employment percentage? A property-management company in the area should have these aggregated.
- How much new for-sale + rental construction is in the pipeline within 1–3 miles? Heavy new supply typically softens prices + rents 12–24 months out; constrained supply supports both.
Investment metrics
- 1% rule
- 0.84% ✗
- Cap rate
- 5.96%
- Cash-on-cash
- -1.20%
- DSCR
- 0.95
- GRM
- 9.9
CMA / ARV
- ARV (on-the-fly)
- $300,300
- Comps found
- 12
Show comp detail 12 sales within ~0.75 mi
| Address | Dist | Beds/Ba | Sqft | Sold | Price | $/sf | Match |
|---|---|---|---|---|---|---|---|
| 2195 Catawba Trace Dr | 0.10mi | 3/2.5 | 1,650 (0%) | 8mo | $279,240 | $169 | 89 |
| 2206 Catawba Trace Dr | 0.14mi | 3/2.5 | 1,650 (0%) | 8mo | $289,980 | $176 | 87 |
| 2198 Catawba Trace Dr | 0.13mi | 3/2.5 | 1,650 (0%) | 9mo | $300,595 | $182 | 86 |
| 2147 Catawba Trace Dr | 0.16mi | 4/2.5 (+1) | 1,813 (+10%) | 1mo | $298,495 | $165 | 70 |
| 2194 Catawba Trace Dr | 0.13mi | 3/2.5 | 1,813 (+10%) | 9mo | $294,750 | $163 | 70 |
| 2219 Catawba Trace Dr | 0.13mi | 3/2.0 | 1,501 (-9%) | 11mo | $299,270 | $199 | 67 |
| 2231 Catawba Trace Dr | 0.16mi | 3/2.5 | 1,813 (+10%) | 12mo | $294,985 | $163 | 66 |
| 106 4th St SE | 0.44mi | 3/2.0 | 1,585 (-4%) | 6mo | $467,080 | $295 | 66 |
| 6040 Bridges St | 0.69mi | 3/2.0 | 1,680 (+2%) | 0mo | $310,000 | $185 | 62 |
| 6016 Bridges St | 0.59mi | 3/2.0 | 1,860 (+13%) | 1mo | $324,900 | $175 | 48 |
| 2351 Hudspeth Rd | 0.71mi | 3/2.0 | 1,779 (+8%) | 11mo | $547,200 | $308 | 42 |
| 105 4th St SE | 0.49mi | 3/2.0 | 1,432 (-13%) | 13mo | $325,000 | $227 | 42 |
Match score weights: distance 35% · size 25% · config 20% · recency 20%. Top-matched comps best support the ARV.
Projected returns pro-forma
-3.0% appreciation · 3.0% rent growth · sell at horizon
- IRR
- -18.3%
- Equity multiple
- 0.36×
- Total profit
- $-50,352
- Equity at exit
- $41,753
- IRR
- -10.5%
- Equity multiple
- 0.36×
- Total profit
- $-50,155
- Equity at exit
- $24,211
Cash invested: $78,407 (down + closing). Projections, not guarantees.
Landlord ↔ Tenant lean methodology
- Overall (STATE)
- 85 Strongly Landlord-Friendly
- State North Carolina
- 85 Strongly Landlord-Friendly · R+3
- County
- — inherits STATE
- City
- — inherits STATE
ZIP-level market 28609
- Home prices YoY
- -9.6%
- Active inventory
- 92
- Price-to-rent
- 9.9×
Monthly cashflow live
- Estimated rent
- $2,350 medium interval (Pro) →
- Mortgage (P&I)
- −$1,468
- Tax est. 1.5%
- −$350 /mo · $4,200/yr
- Insurance
- −$117
- HOA
- −$0
- Vacancy / Maint / Mgmt
- −$494
- Net cashflow
- $-79
Break-even live
UW: 25.0% down · 7.5% · 30yr · 1.5% tax · 5.0% vac · 8.0% maint · 8.0% mgmt
Financing live
Cash to close
- Down payment
- $70,006
- Closing costs
- $8,401
- Reserves months
- —
- Total cash needed
- —
Loan-product check · same deal, 3 products live
Conventional
25% down · 7.5% · 30yr
- Down + closing
- —
- Monthly P&I
- —
- Monthly cashflow
- —
- DSCR
- —
- Eligible?
- —
Personal DTI + credit; lowest rate.
DSCR
20% down · 8.5% · 30yr
- Down + closing
- —
- Monthly P&I
- —
- Monthly cashflow
- —
- DSCR
- —
- Eligible?
- —
No personal income docs; deal must DSCR.
Hard money
10% down · 12.0% · 12mo
- Down + closing
- —
- Monthly P&I
- —
- Monthly cashflow
- —
- DSCR
- —
- Eligible?
- —
Short-term bridge; refi at stabilization.
Rent comps 1 comps
| Address | Beds | Baths | Sqft | Rent | $/sqft | DOM | Units | Dist |
|---|---|---|---|---|---|---|---|---|
| 2802 Legacy Ridge Ln Catawba, NC | 4.0 | 2.5 | 1955 | $2,350 | $1.20 | 22d | 1 | 0.82mi |
Listing history 5 events
-
2026-06-18days on market $280,025 Active 5 DOM
-
2026-06-17days on market $280,025 Active 4 DOM
-
2026-06-16days on market $280,025 Active 3 DOM
-
2026-06-15remarks 699-char remark
-
2026-06-15$280,025 Active 2 DOM
ⓘ Source: listings_history table (triggers on properties + properties_extension) + one-shot
backfill from property_details.listing_events for pre-trigger history.
Nearby sold comps map
Loading sold comps map…
Walkable amenities ~0.75 mi
Loading nearby amenities…
Taxation est. · year 1
- Rental income
- $28,200
- − Mortgage interest
- −$15,686
- − Property taxes
- −$4,200
- − Insurance
- −$1,400
- − Repairs & maintenance
- −$2,256
- − Management
- −$2,256
- − Depreciation
- −$8,146
- Taxable loss
- −$5,744
- Est. tax savings @ 24.0%
- +$1,379
- After-tax cash flow
- $434/yr
For passive investors: Depreciation is non-cash, so a rental often shows a tax loss while cash-flowing — sheltering income. Rental losses are passive: they offset passive income freely, and up to $25,000/yr can offset ordinary (W-2) income if you actively participate and your MAGI is under $100k (phasing out to $0 by $150k); unused losses carry forward. On sale, claimed depreciation is recaptured at up to 25%, and gains may owe capital-gains tax (a 1031 exchange can defer both). Figures are a year-1 estimate at your 24.0% rate — not tax advice; consult a CPA.
Condition & rehab AI · 12 photos
This home is in excellent condition with no visible repairs or maintenance needed. It is move-in ready and offers a great opportunity for both resale and rental value with minor updates like painting and landscaping.
Value-add opportunities
- Both Painting exterior and interior walls — Fresh paint enhances curb appeal and interior aesthetics.
- Both Landscaping improvements — Enhances curb appeal and adds value to the property.
Renovation cost estimate screening
Value-add ROI direction
- Both Painting exterior and interior walls — Fresh paint enhances curb appeal and interior aesthetics. ↑
- Both Landscaping improvements — Enhances curb appeal and adds value to the property. ↑
ⓘ Cost ranges are severity-bucket heuristics (US national rule-of-thumb). Get contractor quotes + a written scope before underwriting a rehab budget.
Schools (NCES district)
- District
- Catawba County Schools
- NCES district ID
- 3700690
- Math proficiency
- 54% ▲ 9.00%
- Reading proficiency
- 51% ▲ 3.00%
- Median HH income
- $48,180
- Composite
- 44.71/100
- National rank
- #2754
- State rank
- #54 of 178 in NC
Livability — Catawba
- Score
- 61/100
- State rank
- #494
- US rank
- #18075
Category grades
Schools grade is shown separately in the Schools card above.
Census & demographics
- Census place
- Catawba, NC
- Population (ZIP)
- 6,617
Population outlook (Catawba County) Hauer SSP2
- Today (2025)
- 156,513 people
- By 2030
- 155,267 · -0.8%
- By 2040
- 151,110 · -3.5%
- By 2050
- 145,524 · -7.0%
- By 2075
- 134,047 · -14.4%
- By 2100
- 119,424 · -23.7%
Race, ethnicity, and origin ACS 2023
- Neighborhood character
- Predominantly White (78%)
- Race & ethnicity
- White 78% Hispanic / Latino 13% Two or more races 9% Black 5%
- Hispanic origin (detail)
- Mexican 9% Puerto Rican 2%
- Common ancestry
- Serbian 2% Italian 2% Romanian 2%
- Foreign-born
- 5% · Canada
- Languages at home
- 94% English-only · Spanish 5% Other Indo-European 1%
Political lean MEDSL · Catawba
- 2024 margin
- Solid R (+38.0) · D 30.6% · R 68.6%
- 2008→2024 swing
- -13.0pp toward R · 2008: -25.0pp · 2024: -38.0pp
- All cycles
- 2024: R+38.0 2020: R+37.0 2016: R+38.0 2012: R+29.6 2008: R+25.0
Not yet ingested
- Civics
- —
Market trends
- HPI YoY
- ▼ -29.61%
- Current HPI
- 277.7327
- Rent YoY
- —
- Metro
- —
- State GDP YoY
- ▲ 3.28%
- F500 in state
- 26
Industry mix (Fortune 500 HQ in NC)
| Industry | F500 HQs | Revenue |
|---|---|---|
| Financial Services | 2 | $213B |
|
||
| Retail | 2 | $95B |
|
||
| Industrial Conglomerate | 1 | $38B |
|
||
| Metals / Steel | 1 | $35B |
|
||
| Utilities | 1 | $30B |
|
||
| Industrial Machinery | 1 | $19B |
|
||
Price history
+0.0% since first listed2 events — show timeline
- 2026-06-14 Listed $280,025 Zillow
- 2026-06-13 Listed $280,025 CANOPYMLS as Distributed by MLS Grid
Cash-flow waterfall
monthlySold comps — $/sqft
last 12 mo · ≤1 miLoading sold comps…