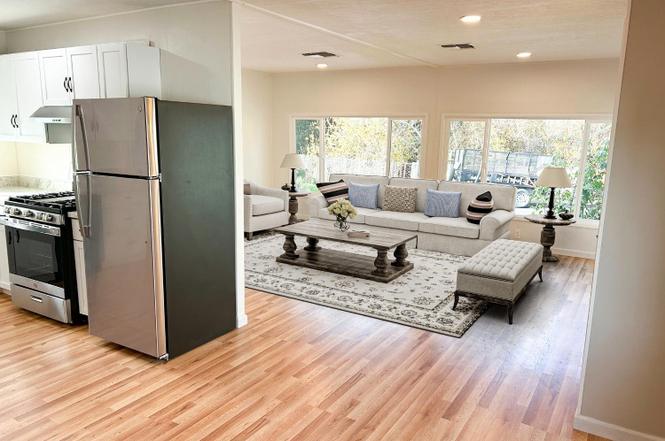
717 N Mcdowell Blvd #511
Petaluma, CA 94954
$250,000C+
2 bd · 2.0 ba ·
1,040 sqft ·
Built 1971
· Manufactured
· Active
· 106 DOM
Cashflow @ list (25.0% down · 7.5%)
Estimated rent
$2,972/mo
Mortgage (P&I)
−$1,311
Tax + insurance
−$843
HOA
−$0
Vac / Maint / Mgmt
−$624
Net cashflow
$194/mo
Annual
$2,323/yr
Cap rate
9.27%
Cash-on-cash
10.63%
DSCR
1.47
1% rule
1.19%
Cash to close
$70,000
Investor read
- This is a 2-bed/2.0-bath manufactured listed at $250k.
- At list price, monthly cash flow is $194 ($2k/yr) — positive.
- The deal already cash-flows at list — no discount required.
- Meets the 1% rule at list price ($3k rent vs $250k).
- It's been on market 106 days — a 9% lower offer ($228k) is reasonable based on typical stale-listing flexibility.
- Recommended offer: $228k (9.0% below list) — sets the bar for market timing.
- Local home prices are declining (-3.0%/yr); year-one equity from $2k of loan paydown is wiped out by about $8k of value loss. Plan a longer hold.
- Location reads 82/100 on livability (#33 in CA, #1,161 nationally) — a professional / high-income tenant draw. Strengths: amenities A+, commute A+, employment A+; Watch: cost of living F.
- Cinnabar Elementary (suburban): math 20% / reading 50% proficiency, ranked #821 of 1,400 in CA (top 59%) — families likely to look elsewhere, expect single-tenant / working-renter base with shorter leases.
- Watch-outs: flood insurance adds $427/mo.
- Market conditions: Rents flat; 61 active listings in the ZIP; 12 comparable units currently listed for rent nearby; rentals at typical pace (median 14d on market — plan ~3-4 weeks tenant-placement turnaround); high-income renter base; 1,039 units permitted in Sonoma County in 2024 (185 in 5+ unit buildings).
- Sonoma County population projected at +8% by 2050 — modest demand growth; plan on rents tracking national, not racing it.
- 7 sale attempts since 2y ago; this cycle's ask has dropped $25k (9%) from the opening price — seller is motivated, your offer sets the floor, not the list.
- Current owner paid $150k; list at $250k implies a 67% gain — meaningful room to come down on a strong offer.
- Climate carrying-cost: in FEMA flood zone AE (mandatory federal flood insurance); moderate wildfire risk — expect insurance premiums to compound above CPI over the hold.
- Cap rate 9.3% vs local median 2.3% in Petaluma — top-decile yield for the area; either an underpriced asset or a hidden risk that comps aren't pricing in. Stress-test before assuming the spread holds.
- This rent runs 31% of the median local income ($114k/yr) — at the standard rent-burdened threshold; future hikes will face affordability resistance.
Questions for listing agent
- It's been on market 106 days. Have you received any prior offers? Is the seller open to a 9% concession, seller financing, or rate buy-down credit?
- Built in 1971 — when were the roof, HVAC, electrical panel, plumbing, and water heater last replaced?
- What's the actual annual flood-insurance premium (NFIP or private), and is the property in a SFHA with mandatory coverage?
- Why hasn't it sold? Are there any deal-killer items the seller is aware of (foundation, flood, title, zoning, code violations)?
- Is there a deadline driving the sale (1031 exchange, divorce, estate, relocation)? That informs how much negotiation room exists.
- Schools are B-rated — typically a magnet for longer-tenancy family renters. What's the average tenant stay here, and is there a school-zone premium baked into asking?
- What's the average days-on-market for RENTAL listings here right now (not sales)? A rising rental-DOM trend means longer vacancies and softer asking-rent achievability than the comps imply.
- What's the recent tenant-quality profile in this submarket — average credit score on applications, eviction rate, late-payment / NSF rate, and stable-employment percentage? A property-management company in the area should have these aggregated.
CashFlowRE · CFR-KP29D47RRKFDTP
· Data 2 days ago
cashflowre.app · 2026-05-29