717 N Mcdowell Blvd #511 · Petaluma, CA
Flood risk 6/10 · Moderate
- FEMA flood zone
- AE
- Chance of flooding over 30 yrs
- 0.72%
- Est. flood insurance / yr
- $1,737 – $8,500
Fire risk 5/10 · Moderate
- Est. fire insurance / yr
- $659 – $1,223
Heat risk 4/10 · Minor
- Hot days now (above 90°F)
- 7 days/yr
- Hot days in 30 yrs
- 16 days/yr
Wind risk 1/10 · Minimal
- Chance of severe wind over 30 yrs
- —
Air-quality risk 9/10 · Severe
- Unhealthy air days now
- 20 days/yr
- Unhealthy air days in 30 yrs
- 20 days/yr
Risk factors via First Street. Map © Google.
Why this score? — see what drove the C+ grade
The composite is a weighted blend of 9 inputs, each scored 0–100. Each bar is that input's sub-score; the figure is the points it added to the 100-point composite (weight × sub-score).
- Cash flow +26.0/30.0
- DSCR +8.7/10.0
- ARV discount +7.5/15.0
- 1% rule +6.9/10.0
- Livability +4.1/5.0
- Schools +3.4/10.0
- Rent growth +2.7/5.0
- Condition / age +2.5/5.0
- Appreciation +0.0/10.0
$250,000
🖨 Deal sheet 📄 Offer letter ✓ Due diligence
Listing remarks
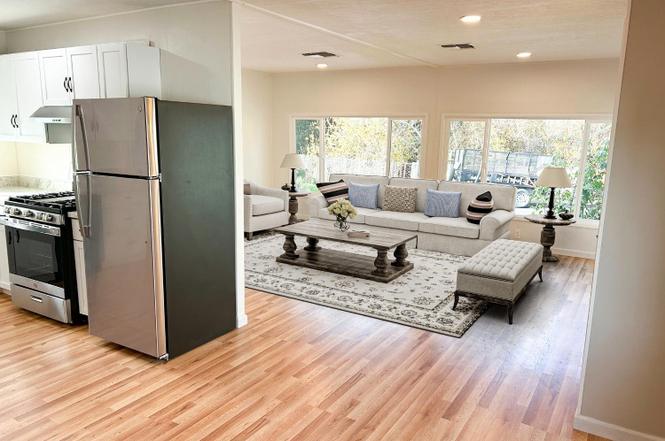
NEW PRICE! Beautifully remodeled throughout. Granite Counters and new Stainless Steel appliances and new cabinets in Open Floorplan Kitchen. New sealant roof, new dual paned windows, New paint in/out. New laminate flooring, new lighting. Newer heating unit. Washer/Dryer included. Views of trees and nature right out of living room windows. Storage shed included. Very few All Age Park manufactured homes for sale. Live and enjoy Petaluma for such a great priced home.
Key facts
- Dual paned windows
- New sealant roof
- Granite counters
Tags
Property features AI
Finance
- Financial info: Monthly land lease amount: $803
- HOA & community: No association; Not a senior community; Land lease (space rent listed separately)
Exterior
- Parking: 2 parking spaces; Off-street parking (unassigned)
- Security: Carbon monoxide detector; Smoke detector; Double-strapped water heater
- Utilities: Public sewer; Gas water heater (natural gas)
- Home design: Manufactured in park; Double wide; Located in Capri Mobile Villa
- Construction: Elastomeric roof; Vinyl skirting; Manufacturer/make listed as KIT
- Exterior features: Corner lot; Shed(s)
Interior
- Kitchen: Dishwasher; Free-standing gas range; Gas cook top; Hood over range; Pantry closet; Stone countertops; Disposal
- Bedrooms: 2 bedrooms
- Flooring: Laminate
- Bathrooms: 2 full bathrooms; Shower stalls
- Heating & cooling: Central heating (natural gas); No cooling
- Interior features: Dishwasher; Disposal; Free-standing gas range; Gas cook top; Hood over range; Gas water heater; Pantry closet; Stone countertops; Thermostat (energy efficient); Carbon monoxide detector; Double-strapped water heater; Smoke detector; Unfurnished
- Laundry & utility: Washer included; Dryer included; Laundry located inside
Neighborhood map
What this means for you Summary
Snapshot
- This is a 2-bed/2.0-bath manufactured listed at $250k.
Deal economics
- At list price, monthly cash flow is $194 ($2k/yr) — positive.
- The deal already cash-flows at list — no discount required.
- Meets the 1% rule at list price ($3k rent vs $250k).
- Recommended offer: $228k (9.0% below list) — sets the bar for market timing.
- Cap rate 9.3% vs local median 2.3% in Petaluma — top-decile yield for the area; either an underpriced asset or a hidden risk that comps aren't pricing in. Stress-test before assuming the spread holds.
Location & tenants
- Location reads 82/100 on livability (#33 in CA, #1,161 nationally) — a professional / high-income tenant draw. Strengths: amenities A+, commute A+, employment A+; Watch: cost of living F.
- Cinnabar Elementary (suburban): math 20% / reading 50% proficiency, ranked #821 of 1,400 in CA (top 59%) — families likely to look elsewhere, expect single-tenant / working-renter base with shorter leases.
- Market conditions: Rents flat; 61 active listings in the ZIP; 12 comparable units currently listed for rent nearby; rentals at typical pace (median 14d on market — plan ~3-4 weeks tenant-placement turnaround); high-income renter base; 1,039 units permitted in Sonoma County in 2024 (185 in 5+ unit buildings).
- This rent runs 31% of the median local income ($114k/yr) — at the standard rent-burdened threshold; future hikes will face affordability resistance.
Forward outlook
- Local home prices are declining (-3.0%/yr); year-one equity from $2k of loan paydown is wiped out by about $8k of value loss. Plan a longer hold.
- Sonoma County population projected at +8% by 2050 — modest demand growth; plan on rents tracking national, not racing it.
Negotiation context
- It's been on market 106 days — a 9% lower offer ($228k) is reasonable based on typical stale-listing flexibility.
- 7 sale attempts since 2y ago; this cycle's ask has dropped $25k (9%) from the opening price — seller is motivated, your offer sets the floor, not the list.
- Current owner paid $150k; list at $250k implies a 67% gain — meaningful room to come down on a strong offer.
Risks & watch-outs
- Watch-outs: flood insurance adds $427/mo.
- Climate carrying-cost: in FEMA flood zone AE (mandatory federal flood insurance); moderate wildfire risk — expect insurance premiums to compound above CPI over the hold.
Questions for the listing agent
- It's been on market 106 days. Have you received any prior offers? Is the seller open to a 9% concession, seller financing, or rate buy-down credit?
- Built in 1971 — when were the roof, HVAC, electrical panel, plumbing, and water heater last replaced?
- What's the actual annual flood-insurance premium (NFIP or private), and is the property in a SFHA with mandatory coverage?
- Why hasn't it sold? Are there any deal-killer items the seller is aware of (foundation, flood, title, zoning, code violations)?
- Is there a deadline driving the sale (1031 exchange, divorce, estate, relocation)? That informs how much negotiation room exists.
- Schools are B-rated — typically a magnet for longer-tenancy family renters. What's the average tenant stay here, and is there a school-zone premium baked into asking?
- What's the average days-on-market for RENTAL listings here right now (not sales)? A rising rental-DOM trend means longer vacancies and softer asking-rent achievability than the comps imply.
- What's the recent tenant-quality profile in this submarket — average credit score on applications, eviction rate, late-payment / NSF rate, and stable-employment percentage? A property-management company in the area should have these aggregated.
- How much new for-sale + rental construction is in the pipeline within 1–3 miles? Heavy new supply typically softens prices + rents 12–24 months out; constrained supply supports both.
Investment metrics
- 1% rule
- 1.19% ✓
- Cap rate
- 9.27%
- Cash-on-cash
- 10.63%
- DSCR
- 1.47
- GRM
- 7.0
CMA / ARV
- ARV (on-the-fly)
- $159,120
- Comps found
- 12
Show comp detail 12 sales within ~0.75 mi
| Address | Dist | Beds/Ba | Sqft | Sold | Price | $/sf | Match |
|---|---|---|---|---|---|---|---|
| 717 N Mcdowell Blvd #111 | 0.07mi | 2/2.0 | 1,064 (+2%) | 4mo | $150,000 | $141 | 90 |
| 63 Oakwood Dr | 0.34mi | 3/2.0 (+1) | 1,040 (0%) | 6mo | $159,000 | $153 | 74 |
| 97 Candlewood Dr | 0.35mi | 2/2.0 | 960 (-8%) | 1mo | $110,000 | $115 | 70 |
| 20 Oakwood Dr | 0.30mi | 3/2.0 (+1) | 1,100 (+6%) | 6mo | $193,000 | $175 | 66 |
| 529 Rosewood Cir | 0.36mi | 3/2.0 (+1) | 1,088 (+5%) | 6mo | $165,000 | $152 | 66 |
| 102 Candlewood Dr | 0.39mi | 2/2.0 | 1,080 (+4%) | 14mo | $160,000 | $148 | 64 |
| 81 Candlewood Dr | 0.33mi | 3/2.0 (+1) | 1,056 (+2%) | 19mo | $200,000 | $189 | 61 |
| 7 Oakwood Dr | 0.23mi | 3/2.0 (+1) | 1,120 (+8%) | 12mo | $160,000 | $143 | 61 |
| 75 Candlewood Dr | 0.32mi | 3/2.0 (+1) | 1,152 (+11%) | 2mo | $180,000 | $156 | 61 |
| 71 Candlewood Dr | 0.33mi | 2/2.0 | 1,188 (+14%) | 8mo | $212,000 | $178 | 54 |
| 576 Birchwood Dr | 0.35mi | 2/2.0 | 1,188 (+14%) | 9mo | $215,000 | $181 | 53 |
| 55 E Napa Dr | 0.42mi | 2/2.0 | 1,120 (+8%) | 19mo | $160,000 | $143 | 52 |
Match score weights: distance 35% · size 25% · config 20% · recency 20%. Top-matched comps best support the ARV.
Projected returns pro-forma
-3.0% appreciation · 0.61% rent growth · sell at horizon
- IRR
- -14.3%
- Equity multiple
- 0.50×
- Total profit
- $-34,853
- Equity at exit
- $37,276
- IRR
- -11.0%
- Equity multiple
- 0.42×
- Total profit
- $-40,529
- Equity at exit
- $21,615
Cash invested: $70,000 (down + closing). Projections, not guarantees.
Landlord ↔ Tenant lean methodology
- Overall (STATE)
- 18 Strongly Tenant-Friendly
- State California
- 18 Strongly Tenant-Friendly · D+13
- County
- — inherits STATE
- City
- — inherits STATE
ZIP-level market 94954
- Rents YoY
- 0.6%
- Active inventory
- 61
- Price-to-rent
- 7.0×
Monthly cashflow live
- Estimated rent
- $2,972 high interval (Pro) →
- Mortgage (P&I)
- −$1,311
- Tax est. 1.5%
- −$312 /mo · $3,750/yr
- Insurance
- −$104
- Flood insurance flood zone
- −$427 /mo · $5,118/yr
- HOA
- −$0
- Vacancy / Maint / Mgmt
- −$624
- Net cashflow
- $194
Break-even live
UW: 25.0% down · 7.5% · 30yr · 1.5% tax · 5.0% vac · 8.0% maint · 8.0% mgmt
Financing live
Cash to close
- Down payment
- $62,500
- Closing costs
- $7,500
- Reserves months
- —
- Total cash needed
- —
Loan-product check · same deal, 3 products live
Conventional
25% down · 7.5% · 30yr
- Down + closing
- —
- Monthly P&I
- —
- Monthly cashflow
- —
- DSCR
- —
- Eligible?
- —
Personal DTI + credit; lowest rate.
DSCR
20% down · 8.5% · 30yr
- Down + closing
- —
- Monthly P&I
- —
- Monthly cashflow
- —
- DSCR
- —
- Eligible?
- —
No personal income docs; deal must DSCR.
Hard money
10% down · 12.0% · 12mo
- Down + closing
- —
- Monthly P&I
- —
- Monthly cashflow
- —
- DSCR
- —
- Eligible?
- —
Short-term bridge; refi at stabilization.
Rent comps 12 comps
| Address | Beds | Baths | Sqft | Rent | $/sqft | DOM | Units | Dist |
|---|---|---|---|---|---|---|---|---|
| 1453 Capri Ave Petaluma, CA | 3.0 | 2.0 | 1368 | $3,200 | $2.34 | 14d | 1 | 0.33mi |
| 495 N McDowell Blvd Petaluma, CA | 1.0–2.0 | 1.0–2.0 | 1028 | $3,432 | $3.34 | 2d | 3 | 0.41mi |
| 240 Park Place Dr Petaluma, CA | 2.0 | 1.0 | 872 | $2,450 | $2.81 | 14d | 1 | 0.80mi |
| 333 N McDowell Blvd Petaluma, CA | 1.0–2.0 | 1.0 | 672 | $2,141 | $3.18 | 2d | 7 | 0.82mi |
| 1412 Mauro Pietro Dr #206 Petaluma, CA | 2.0 | 2.0 | 943 | $2,995 | $3.18 | 14d | 1 | 0.88mi |
| 1412 Mauro Pietro Dr #201 Petaluma, CA | 3.0 | 2.0 | 1165 | $2,950 | $2.53 | 14d | 1 | 0.88mi |
| 1900 Sestri Ln Petaluma, CA | 1.0–2.0 | 1.0–2.0 | 716 | $2,998 | $4.19 | 2d | 6 | 0.94mi |
| 142 Cherry St Petaluma, CA | 2.0 | 1.0 | 874 | $2,450 | $2.80 | 14d | 1 | 1.05mi |
| 132 Maria Dr Petaluma, CA | 3.0 | 2.0 | 1056 | $2,895 | $2.74 | 14d | 1 | 1.13mi |
| 907 Mustang Ct Petaluma, CA | 1.0 | 1.0 | 700 | $2,550 | $3.64 | 14d | 1 | 1.33mi |
| 350 N Water St Petaluma, CA | 2.0 | 1.0–2.5 | 860 | $3,921 | $4.56 | 2d | 15 | 1.34mi |
| 55 Maria Dr Petaluma, CA | 1.0–2.0 | 1.0–2.0 | 957 | $3,548 | $3.71 | 14d | 6 | 1.40mi |
Listing history 37 events
-
2026-06-18days on market $250,000 Active 106 DOM
-
2026-06-17days on market $250,000 Active 105 DOM
-
2026-06-16days on market $250,000 Active 104 DOM
-
2026-06-15days on market $250,000 Active 103 DOM
-
2026-06-14days on market $250,000 Active 101 DOM
-
2026-06-13days on market $250,000 Active 100 DOM
-
2026-06-10days on market $250,000 Active 98 DOM
-
2026-06-09days on market $250,000 Active 97 DOM
-
2026-06-08days on market $250,000 Active 96 DOM
-
2026-06-07days on market $250,000 Active 95 DOM
-
2026-06-05days on market $250,000 Active 92 DOM
-
2026-06-03days on market $250,000 Active 91 DOM
-
2026-06-02days on market $250,000 Active 90 DOM
-
2026-06-01days on market $250,000 Active 89 DOM
-
2026-05-31days on market $250,000 Active 88 DOM
-
2026-05-30days on market $250,000 Active 87 DOM
-
2026-05-07status Active
-
2026-04-28status Pending
-
2026-04-07historical Contingent (Show)
-
2026-03-09price $250,000
-
2026-02-24$275,000 Active
-
2025-10-02price $275,000
-
2025-09-15price $285,000
-
2025-09-05status Active
-
2025-09-05price $280,000
-
2025-08-30price $285,000
-
2025-07-26price $287,000
-
2025-06-17price $289,000
-
2025-06-04status Active
-
2025-04-06price $299,000
-
2025-02-22price $325,000
-
2024-12-07$350,000 Active
-
2024-11-30$350,000 Active
-
2024-08-27soldstatus $150,000 Closed
-
2024-08-26status Pending
-
2024-04-18historical Contingent (Show)
-
2024-04-09$129,000 Active
ⓘ Source: listings_history table (triggers on properties + properties_extension) + one-shot
backfill from property_details.listing_events for pre-trigger history.
Climate risk First Street
- Flood 6/10 Major FEMA zone AE · 72% chance over 30 yrs
- Wildfire 5/10 Major
- Heat 4/10 Moderate 7 d/yr ≥90°F today · 16 d/yr by 30 yrs out
- Wind 1/10 Low
- Air quality 9/10 Extreme 20 unhealthy d/yr today · 20 by 30 yrs out
Nearby sold comps map
Loading sold comps map…
Walkable amenities ~0.75 mi
Loading nearby amenities…
Taxation est. · year 1
- Rental income
- $35,663
- − Mortgage interest
- −$14,004
- − Property taxes
- −$3,750
- − Insurance
- −$6,368
- − Repairs & maintenance
- −$2,853
- − Management
- −$2,853
- − Depreciation
- −$7,273
- Taxable loss
- −$1,438
- Est. tax savings @ 24.0%
- +$345
- After-tax cash flow
- $2,668/yr
For passive investors: Depreciation is non-cash, so a rental often shows a tax loss while cash-flowing — sheltering income. Rental losses are passive: they offset passive income freely, and up to $25,000/yr can offset ordinary (W-2) income if you actively participate and your MAGI is under $100k (phasing out to $0 by $150k); unused losses carry forward. On sale, claimed depreciation is recaptured at up to 25%, and gains may owe capital-gains tax (a 1031 exchange can defer both). Figures are a year-1 estimate at your 24.0% rate — not tax advice; consult a CPA.
Schools (NCES district)
- District
- Cinnabar Elementary
- NCES district ID
- 0608700
- Math proficiency
- 20% ▼ -5.00%
- Reading proficiency
- 50% ▲ 10.00%
- Median HH income
- $65,800
- Composite
- 34.43/100
- National rank
- #10166
- State rank
- #821 of 1400 in CA
Livability — Petaluma
- Score
- 82/100
- State rank
- #33
- US rank
- #1161
Category grades
Schools grade is shown separately in the Schools card above.
Census & demographics
- Census place
- Petaluma, CA
- County
- Sonoma County · 449,805 people
- City population
- 71,359
- Metro
- Santa Rosa-Petaluma, CA
- Population (ZIP)
- 37,574
- Household income
- $113,527
- Rent vs Own
- Severe rent burden
- 1421.0
Population outlook (Sonoma County) Hauer SSP2
- Today (2025)
- 539,935 people
- By 2030
- 554,870 · +2.8%
- By 2040
- 573,262 · +6.2%
- By 2050
- 580,715 · +7.6%
- By 2075
- 579,229 · +7.3%
- By 2100
- 547,835 · +1.5%
Race, ethnicity, and origin ACS 2023
- Neighborhood character
- Majority White (64%)
- Race & ethnicity
- White 64% Hispanic / Latino 23% Two or more races 16% Asian 4% Black 2% Native American 1%
- Hispanic origin (detail)
- Mexican 15%
- Common ancestry
- Lithuanian 4% Italian 4% Slovak 2%
- Foreign-born
- 17% · Canada, China, Vietnam
- Languages at home
- 78% English-only · Spanish 16% Other Indo-European 2% Tagalog/Filipino 1%
Political lean MEDSL · Sonoma
- 2024 margin
- Solid D (+46.2) · D 71.4% · R 25.2% · Other 3.3%
- 2008→2024 swing
- -3.4pp toward R · 2008: 49.6pp · 2024: 46.2pp
- All cycles
- 2024: D+46.2 2020: D+51.5 2016: D+47.9 2012: D+44.9 2008: D+49.6
Not yet ingested
- Civics
- —
Market trends
- HPI YoY
- ▼ -813.92%
- Current HPI
- 245.4729
- Rent YoY
- ▲ 0.61%
- Metro
- Santa Rosa-Petaluma, CA
- State GDP YoY
- ▲ 3.21%
- F500 in state
- 116
Industry mix (Fortune 500 HQ in CA)
| Industry | F500 HQs | Revenue |
|---|---|---|
| Technology | 27 | $1,492B |
|
||
| Financial Services | 3 | $174B |
|
||
| Retail | 3 | $44B |
|
||
| Insurance | 3 | $26B |
|
||
| Media / Entertainment | 2 | $115B |
|
||
| Pharmaceuticals / Biotech | 2 | $62B |
|
||
Price history
+93.8% since first listed21 events — show timeline
- 2026-05-07 Relisted — BAREIS
- 2026-04-28 Pending — BAREIS
- 2026-04-07 Contingent — BAREIS
- 2026-03-09 Price Changed $250,000 BAREIS
- 2026-02-24 Listed $275,000 BAREIS
- 2025-10-02 Price Changed $275,000 BAREIS
- 2025-09-15 Price Changed $285,000 BAREIS
- 2025-09-05 Relisted — BAREIS
- 2025-09-05 Price Changed $280,000 BAREIS
- 2025-08-30 Price Changed $285,000 BAREIS
- 2025-07-26 Price Changed $287,000 BAREIS
- 2025-06-17 Price Changed $289,000 BAREIS
- 2025-06-04 Relisted — BAREIS
- 2025-04-06 Price Changed $299,000 BAREIS
- 2025-02-22 Price Changed $325,000 BAREIS
- 2024-12-07 Listed $350,000 BAREIS
- 2024-11-30 Listed $350,000 BAREIS
- 2024-08-27 Sold (MLS) $150,000 BAREIS
- 2024-08-26 Pending — BAREIS
- 2024-04-18 Contingent — BAREIS
- 2024-04-09 Listed $129,000 BAREIS
Property tax history
+1.5%/yrLatest (2025): $124 · +174.7% YoY. Source: county tax records.
Cash-flow waterfall
monthlySold comps — $/sqft
last 12 mo · ≤1 miLoading sold comps…