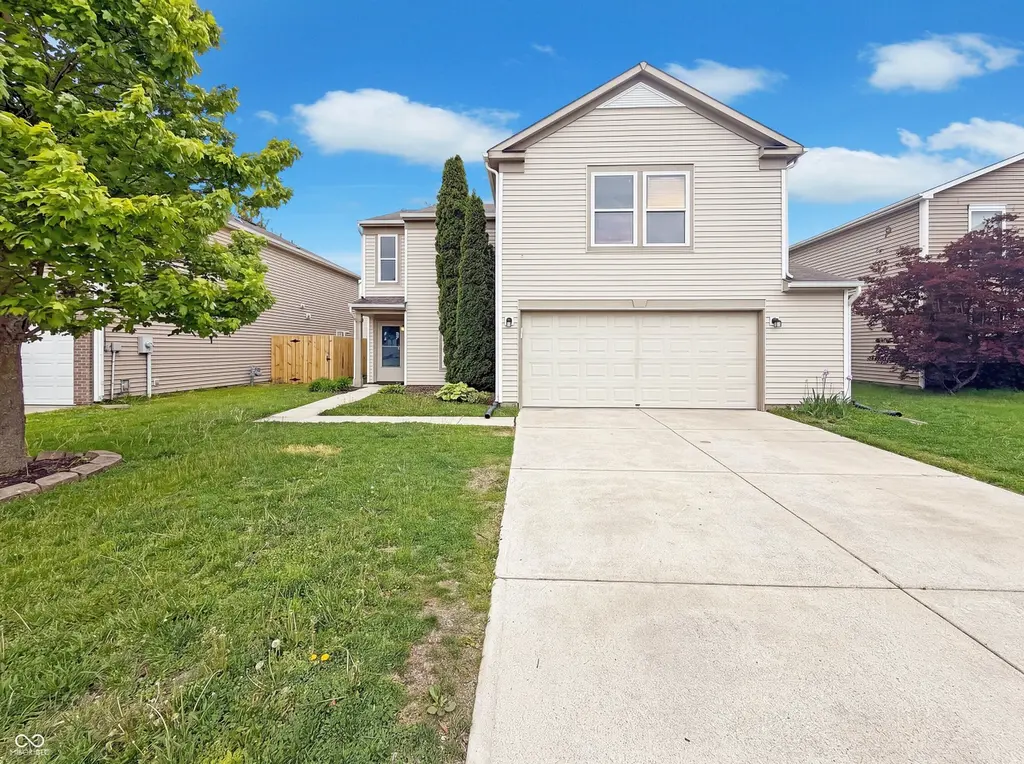
8134 S Firefly Dr
Ingalls, IN 46064
$299,000D
4 bd · 2.0 ba ·
2,290 sqft ·
Built 2005
· SingleFamily
· Active
· 49 DOM
Cashflow @ list (25.0% down · 7.5%)
Estimated rent
$2,368/mo
Mortgage (P&I)
−$1,568
Tax + insurance
−$293
HOA
−$38
Vac / Maint / Mgmt
−$497
Net cashflow
$-29/mo
Annual
$-346/yr
Cap rate
6.18%
Cash-on-cash
-0.41%
DSCR
0.98
1% rule
0.79%
Cash to close
$83,720
Investor read
- This is a 4-bed/2.0-bath single-family listed at $299k.
- At list price, monthly cash flow is $-29 ($-346/yr) — negative.
- To cash-flow at today's rent, offer at most $294k (1.7% below list).
- To meet the 1% rule (rent ≥ 1% of price), the offer needs to be $237k (20.8% below list).
- It's been on market 49 days — a 3% lower offer ($290k) is reasonable based on typical stale-listing flexibility.
- Recommended offer: $237k (20.8% below list) — sets the bar for 1% rule.
- Local home prices are declining (-3.0%/yr); year-one equity from $2k of loan paydown is wiped out by about $9k of value loss. Plan a longer hold.
- Location reads 64/100 on livability (#391 in IN) — a middle-class / working-renter tenant base. Strengths: crime A+, cost of living A+, housing A+; Watch: employment C-, amenities F, commute F.
- South Madison Community School Corporation (rural): math 44% / reading 52% proficiency, ranked #60 of 301 in IN (top 20%) — families likely to look elsewhere, expect single-tenant / working-renter base with shorter leases.
- Zoned schools: Maple Ridge Elementary School (math 42% / reading 41%, grade F, #478 of 994 statewide, top 49%, 783 students, 46% FRL); Pendleton Heights High School (math 36% / reading 77%, grade C, #70 of 369 statewide, top 19%, 1,357 students, 31% FRL).
- Market conditions: 232 active listings in the ZIP; 3 comparable units currently listed for rent nearby; rentals leasing fast (median 12d on market — plan ~1-2 weeks tenant-placement turnaround); 184 units permitted in Madison County in 2024 (0 in 5+ unit buildings).
- Madison County population projected at -14% by 2050 — secular population decline; favor cash flow + early exit over multi-decade hold.
- 10 sale attempts since 20y ago with the ask held roughly flat each time — persistent listings suggest the price (not the market) is what's stuck; bring a comps-based counter.
- Cap rate 6.2% vs local median 4.0% in Ingalls — top-decile yield for the area; either an underpriced asset or a hidden risk that comps aren't pricing in. Stress-test before assuming the spread holds.
Questions for listing agent
- What do current leases actually rent for vs. the listed asking? Can we see a recent rent roll and the last 12 months of T-12 income?
- It's been on market 49 days. Have you received any prior offers? Is the seller open to a 21% concession, seller financing, or rate buy-down credit?
- What does the HOA fee cover, when was the last increase, and are there any pending special assessments or reserve-fund shortfalls?
- Is there a deadline driving the sale (1031 exchange, divorce, estate, relocation)? That informs how much negotiation room exists.
- Schools are F-rated, which usually means shorter tenancies and higher turnover. Who's the typical renter profile here, and what's been the actual vacancy rate?
- The area grade is low — what's the realistic commute time and amenity access for the typical tenant pool here? Any planned neighborhood developments (good or bad) we should know about?
- What's the average days-on-market for RENTAL listings here right now (not sales)? A rising rental-DOM trend means longer vacancies and softer asking-rent achievability than the comps imply.
- What's the recent tenant-quality profile in this submarket — average credit score on applications, eviction rate, late-payment / NSF rate, and stable-employment percentage? A property-management company in the area should have these aggregated.
CashFlowRE · CFR-KS6TVH4KVEFFPC
· Data 2 days ago
cashflowre.app · 2026-05-29