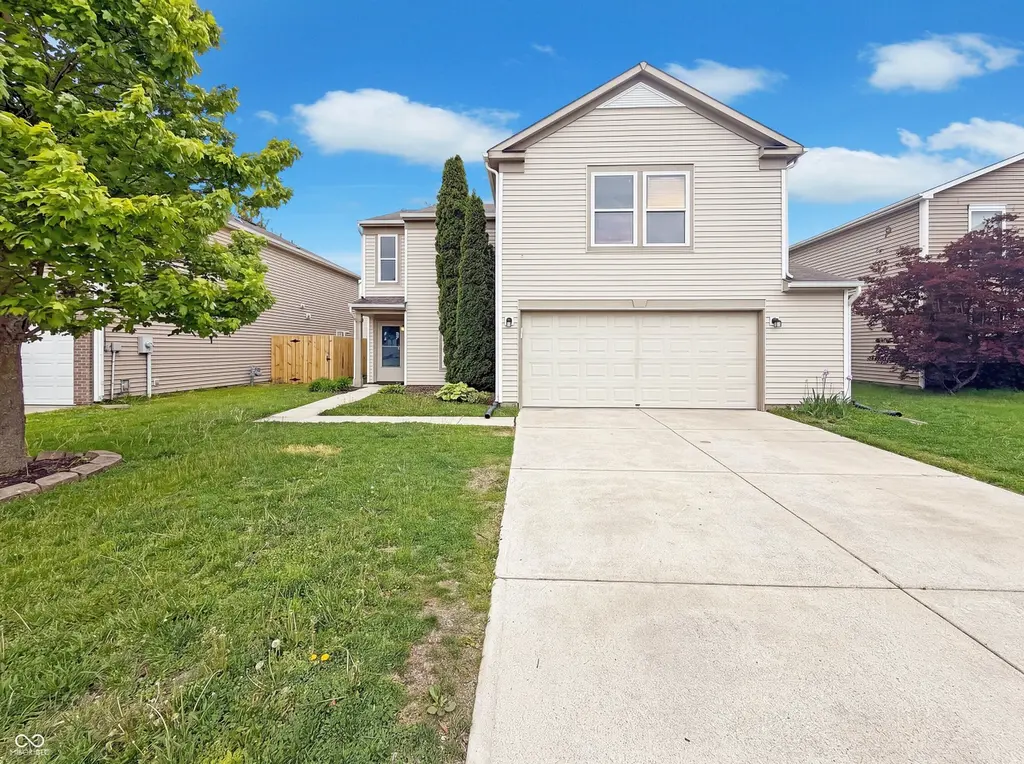
8134 S Firefly Dr · Ingalls, IN
Flood risk 1/10 · Minimal
- FEMA flood zone
- X (unshaded)
- Chance of flooding over 30 yrs
- 0.0%
- Est. flood insurance / yr
- $507 – $1,088
Fire risk 1/10 · Minimal
- Est. fire insurance / yr
- $717 – $1,331
Heat risk 3/10 · Minor
- Hot days now (above 101°F)
- 7 days/yr
- Hot days in 30 yrs
- 18 days/yr
Wind risk 2/10 · Minimal
- Chance of severe wind over 30 yrs
- 1.0%
Air-quality risk 2/10 · Minimal
- Unhealthy air days now
- 2 days/yr
- Unhealthy air days in 30 yrs
- 2 days/yr
Risk factors via First Street. Map © Google.
Why this score? — see what drove the D grade
The composite is a weighted blend of 9 inputs, each scored 0–100. Each bar is that input's sub-score; the figure is the points it added to the 100-point composite (weight × sub-score).
- Cash flow +12.8/30.0
- ARV discount +9.0/15.0
- Schools +4.2/10.0
- DSCR +3.8/10.0
- Livability +3.2/5.0
- 1% rule +2.9/10.0
- Rent growth +2.5/5.0
- Condition / age +2.5/5.0
- Appreciation +0.0/10.0
$299,000
🖨 Deal sheet 📄 Offer letter ✓ Due diligence
Listing remarks MLS
Well maintained 3bed/2.5bath with bonus room up, walk-in closets, garage bump-out, lower level all tile and laminate, bathrooms upstairs are tiled, can lights, whole house speaker system, deck with privacy, all kitchen appliances stay, and much more. Summerlake offers pool, clubhouse, tennis, basketball, sand volleyball, playgrounds, and lake. All this 5 minutes from Hamilton Town Center and easy access to I-69 for a quick commute North or South. Seller is offering a 1-year home warranty.
Key facts
- Fenced in backyard
- Exterior deck
- Walk in closet
Tags
Property features AI
Finance
- HOA & community: Homeowners association with semi-annual fee of $225; Mandatory HOA
Exterior
- Parking: Attached 2-car garage (approximately 460 sq ft)
- Utilities: Public water; Municipal sewer
- Home design: Single-family residence; Two levels
- Construction: Brick and vinyl siding exterior; Slab foundation
- Exterior features: Lot under 1/4 acre
Interior
- Kitchen: Microwave; Dishwasher; Gas oven
- Bedrooms: Four bedrooms on the upper level
- Bathrooms: Two full bathrooms; One half bathroom
- Heating & cooling: Forced air heating; Central air conditioning
- Interior features: Attic access; Walk-in closet(s)
Neighborhood map
What this means for you Summary
Snapshot
- This is a 4-bed/2.0-bath single-family listed at $299k.
Deal economics
- At list price, monthly cash flow is $-29 ($-346/yr) — negative.
- To cash-flow at today's rent, offer at most $294k (1.7% below list).
- To meet the 1% rule (rent ≥ 1% of price), the offer needs to be $237k (20.8% below list).
- Recommended offer: $237k (20.8% below list) — sets the bar for 1% rule.
- Cap rate 6.2% vs local median 4.0% in Ingalls — top-decile yield for the area; either an underpriced asset or a hidden risk that comps aren't pricing in. Stress-test before assuming the spread holds.
Location & tenants
- Location reads 64/100 on livability (#391 in IN) — a middle-class / working-renter tenant base. Strengths: crime A+, cost of living A+, housing A+; Watch: employment C-, amenities F, commute F.
- South Madison Community School Corporation (rural): math 44% / reading 52% proficiency, ranked #60 of 301 in IN (top 20%) — families likely to look elsewhere, expect single-tenant / working-renter base with shorter leases.
- Zoned schools: Maple Ridge Elementary School (math 42% / reading 41%, grade F, #478 of 994 statewide, top 49%, 783 students, 46% FRL); Pendleton Heights High School (math 36% / reading 77%, grade C, #70 of 369 statewide, top 19%, 1,357 students, 31% FRL).
- Market conditions: 232 active listings in the ZIP; 3 comparable units currently listed for rent nearby; rentals leasing fast (median 12d on market — plan ~1-2 weeks tenant-placement turnaround); 184 units permitted in Madison County in 2024 (0 in 5+ unit buildings).
Forward outlook
- Local home prices are declining (-3.0%/yr); year-one equity from $2k of loan paydown is wiped out by about $9k of value loss. Plan a longer hold.
- Madison County population projected at -14% by 2050 — secular population decline; favor cash flow + early exit over multi-decade hold.
Negotiation context
- It's been on market 49 days — a 3% lower offer ($290k) is reasonable based on typical stale-listing flexibility.
- 10 sale attempts since 20y ago with the ask held roughly flat each time — persistent listings suggest the price (not the market) is what's stuck; bring a comps-based counter.
Questions for the listing agent
- What do current leases actually rent for vs. the listed asking? Can we see a recent rent roll and the last 12 months of T-12 income?
- It's been on market 49 days. Have you received any prior offers? Is the seller open to a 21% concession, seller financing, or rate buy-down credit?
- What does the HOA fee cover, when was the last increase, and are there any pending special assessments or reserve-fund shortfalls?
- Is there a deadline driving the sale (1031 exchange, divorce, estate, relocation)? That informs how much negotiation room exists.
- Schools are F-rated, which usually means shorter tenancies and higher turnover. Who's the typical renter profile here, and what's been the actual vacancy rate?
- The area grade is low — what's the realistic commute time and amenity access for the typical tenant pool here? Any planned neighborhood developments (good or bad) we should know about?
- What's the average days-on-market for RENTAL listings here right now (not sales)? A rising rental-DOM trend means longer vacancies and softer asking-rent achievability than the comps imply.
- What's the recent tenant-quality profile in this submarket — average credit score on applications, eviction rate, late-payment / NSF rate, and stable-employment percentage? A property-management company in the area should have these aggregated.
- How much new for-sale + rental construction is in the pipeline within 1–3 miles? Heavy new supply typically softens prices + rents 12–24 months out; constrained supply supports both.
Investment metrics
- 1% rule
- 0.79% ✗
- Cap rate
- 6.18%
- Cash-on-cash
- -0.41%
- DSCR
- 0.98
- GRM
- 10.5
CMA / ARV
- ARV (on-the-fly)
- $309,150
- Comps found
- 12
Show comp detail 12 sales within ~0.75 mi
| Address | Dist | Beds/Ba | Sqft | Sold | Price | $/sf | Match |
|---|---|---|---|---|---|---|---|
| 8115 S Cricket Ln | 0.08mi | 4/2.5 | 2,328 (+2%) | 6mo | $310,000 | $133 | 86 |
| 9543 W Campfire Dr | 0.12mi | 3/2.5 (-1) | 2,226 (-3%) | 2mo | $286,500 | $129 | 81 |
| 9366 W Rising Sun Dr | 0.29mi | 3/2.5 (-1) | 2,318 (+1%) | 2mo | $313,000 | $135 | 75 |
| 8032 W Campfire Dr | 0.23mi | 3/2.5 (-1) | 2,174 (-5%) | 2mo | $287,000 | $132 | 72 |
| 9899 Constellation Dr | 0.39mi | 3/2.5 (-1) | 2,317 (+1%) | 6mo | $385,000 | $166 | 67 |
| 9848 Bryce Blvd | 0.22mi | 3/2.0 (-1) | 2,040 (-11%) | 0mo | $337,000 | $165 | 66 |
| 9478 W Lantern Ln | 0.18mi | 3/2.5 (-1) | 2,035 (-11%) | 2mo | $270,000 | $133 | 65 |
| 9835 Bryce Blvd | 0.22mi | 3/2.0 (-1) | 2,032 (-11%) | 4mo | $372,000 | $183 | 63 |
| 8346 S Firefly Dr | 0.21mi | 3/2.5 (-1) | 2,050 (-10%) | 5mo | $268,000 | $131 | 62 |
| 9511 W Quarter Moon Dr | 0.29mi | 3/2.5 (-1) | 2,030 (-11%) | 1mo | $286,000 | $141 | 60 |
| 9399 W Rising Sun Dr | 0.26mi | 3/2.5 (-1) | 2,620 (+14%) | 3mo | $280,000 | $107 | 54 |
| 13367 Champagne St | 0.55mi | 3/2.0 (-1) | 2,052 (-10%) | 6mo | $460,000 | $224 | 47 |
Match score weights: distance 35% · size 25% · config 20% · recency 20%. Top-matched comps best support the ARV.
Projected returns pro-forma
-3.0% appreciation · 3.0% rent growth · sell at horizon
- IRR
- -17.0%
- Equity multiple
- 0.40×
- Total profit
- $-50,352
- Equity at exit
- $44,582
- IRR
- -9.0%
- Equity multiple
- 0.44×
- Total profit
- $-46,480
- Equity at exit
- $25,852
Cash invested: $83,720 (down + closing). Projections, not guarantees.
Landlord ↔ Tenant lean methodology
- Overall (STATE)
- 90 Strongly Landlord-Friendly
- State Indiana
- 90 Strongly Landlord-Friendly · R+11
- County
- — inherits STATE
- City
- — inherits STATE
ZIP-level market 46064
- Active inventory
- 232
- Price-to-rent
- 10.5×
Monthly cashflow live
- Estimated rent
- $2,368 medium interval (Pro) →
- Mortgage (P&I)
- −$1,568
- Tax from tax record
- −$169 /mo · $2,024/yr
- Insurance
- −$125
- HOA
- −$38
- Vacancy / Maint / Mgmt
- −$497
- Net cashflow
- $-29
Break-even live
UW: 25.0% down · 7.5% · 30yr · 1.5% tax · 5.0% vac · 8.0% maint · 8.0% mgmt
Financing live
Cash to close
- Down payment
- $74,750
- Closing costs
- $8,970
- Reserves months
- —
- Total cash needed
- —
Loan-product check · same deal, 3 products live
Conventional
25% down · 7.5% · 30yr
- Down + closing
- —
- Monthly P&I
- —
- Monthly cashflow
- —
- DSCR
- —
- Eligible?
- —
Personal DTI + credit; lowest rate.
DSCR
20% down · 8.5% · 30yr
- Down + closing
- —
- Monthly P&I
- —
- Monthly cashflow
- —
- DSCR
- —
- Eligible?
- —
No personal income docs; deal must DSCR.
Hard money
10% down · 12.0% · 12mo
- Down + closing
- —
- Monthly P&I
- —
- Monthly cashflow
- —
- DSCR
- —
- Eligible?
- —
Short-term bridge; refi at stabilization.
Rent comps 3 comps
| Address | Beds | Baths | Sqft | Rent | $/sqft | DOM | Units | Dist |
|---|---|---|---|---|---|---|---|---|
| 9518 W Midnight Dr Pendleton, IN | 3.0 | 2.5 | 2868 | $2,186 | $0.76 | 4d | 1 | 0.17mi |
| 9160 Larson Dr Pendleton, IN | 5.0 | 3.5 | 3059 | $2,796 | $0.91 | 23d | 1 | 0.65mi |
| 15905 Tharp Woods Dr Fishers, IN | 4.0 | 3.0 | 2442 | $2,850 | $1.17 | 12d | 1 | 1.26mi |
HOA detail
- Monthly dues
- $38 · $456/yr
- Likely covers
- landscapingpool
Listing history 37 events
-
2026-06-18days on market $299,000 Active 49 DOM
-
2026-06-17days on market $299,000 Active 48 DOM
-
2026-06-16days on market $299,000 Active 47 DOM
-
2026-06-15days on market $299,000 Active 46 DOM
-
2026-06-13days on market $299,000 Active 44 DOM
-
2026-06-13pricedays on market $299,000 Active 43 DOM
-
2026-06-09days on market $307,000 Active 40 DOM
-
2026-06-08days on market $307,000 Active 39 DOM
-
2026-06-07days on market $307,000 Active 38 DOM
-
2026-06-05days on market $307,000 Active 35 DOM
-
2026-06-03days on market $307,000 Active 34 DOM
-
2026-06-02days on market $307,000 Active 33 DOM
-
2026-06-01days on market $307,000 Active 32 DOM
-
2026-05-31days on market $307,000 Active 31 DOM
-
2026-05-14price $307,000
-
2026-04-30$310,000 Active
-
2026-04-17soldstatus $296,800
-
2017-01-20soldstatus $146,330 Sold 493-char remark
Show marketing remark (493 chars)
Well maintained 3bed/2.5bath with bonus room up, walk-in closets, garage bump-out, lower level all tile and laminate, bathrooms upstairs are tiled, can lights, whole house speaker system, deck with privacy, all kitchen appliances stay, and much more. Summerlake offers pool, clubhouse, tennis, basketball, sand volleyball, playgrounds, and lake. All this 5 minutes from Hamilton Town Center and easy access to I-69 for a quick commute North or South. Seller is offering a 1-year home warranty.
-
2016-12-22status Pending 493-char remark
Show marketing remark (493 chars)
Well maintained 3bed/2.5bath with bonus room up, walk-in closets, garage bump-out, lower level all tile and laminate, bathrooms upstairs are tiled, can lights, whole house speaker system, deck with privacy, all kitchen appliances stay, and much more. Summerlake offers pool, clubhouse, tennis, basketball, sand volleyball, playgrounds, and lake. All this 5 minutes from Hamilton Town Center and easy access to I-69 for a quick commute North or South. Seller is offering a 1-year home warranty.
-
2016-11-19$145,000 Active 493-char remark
Show marketing remark (493 chars)
Well maintained 3bed/2.5bath with bonus room up, walk-in closets, garage bump-out, lower level all tile and laminate, bathrooms upstairs are tiled, can lights, whole house speaker system, deck with privacy, all kitchen appliances stay, and much more. Summerlake offers pool, clubhouse, tennis, basketball, sand volleyball, playgrounds, and lake. All this 5 minutes from Hamilton Town Center and easy access to I-69 for a quick commute North or South. Seller is offering a 1-year home warranty.
-
2014-04-14historical 498-char remark
Show marketing remark (498 chars)
Check out this sparkling 3bed home w/ bonus room/loft. Upgrades & updates everywhere from laminate floors, new ceramic tile, recessed, under cabinet and reading lights in the master have been installed, walls are ready for large flatscreens, whole house speaker system installed, large deck out back with canopy surrounded by mature trees for privacy, and much more. Garage bump-out storage area makes it easy to get 2 cars inside. All kitchen appliances stay and seller offering home warranty.
-
2014-04-01soldstatus $129,000 498-char remark
Show marketing remark (498 chars)
Check out this sparkling 3bed home w/ bonus room/loft. Upgrades & updates everywhere from laminate floors, new ceramic tile, recessed, under cabinet and reading lights in the master have been installed, walls are ready for large flatscreens, whole house speaker system installed, large deck out back with canopy surrounded by mature trees for privacy, and much more. Garage bump-out storage area makes it easy to get 2 cars inside. All kitchen appliances stay and seller offering home warranty.
-
2014-01-20$129,900 498-char remark
Show marketing remark (498 chars)
Check out this sparkling 3bed home w/ bonus room/loft. Upgrades & updates everywhere from laminate floors, new ceramic tile, recessed, under cabinet and reading lights in the master have been installed, walls are ready for large flatscreens, whole house speaker system installed, large deck out back with canopy surrounded by mature trees for privacy, and much more. Garage bump-out storage area makes it easy to get 2 cars inside. All kitchen appliances stay and seller offering home warranty.
-
2013-05-14historical
-
2012-11-16historical
-
2012-11-16$129,000
-
2012-05-16$129,000
-
2011-03-02historical
-
2010-08-31$134,000
-
2010-05-04historical
-
2009-06-10historical
-
2009-06-09$141,000
-
2009-03-11$150,000
-
2009-01-22historical
-
2008-01-21$139,900
-
2006-02-14soldstatus $132,605
-
2006-02-14$133,040
ⓘ Source: listings_history table (triggers on properties + properties_extension) + one-shot
backfill from property_details.listing_events for pre-trigger history.
Tax reassessment forecast IN · Partial reset (capped growth)
- Current annual tax
- $2,024 · $169/mo
- Projected year-2 tax
- $2,283 · $190/mo
- Expected delta
- +$259/yr (+$22/mo · 12.8%)
ⓘ Screening estimate from a state-policy table — verify with the county assessor before closing.
Climate risk First Street
- Flood 1/10 Low FEMA zone X (unshaded) · 0% chance over 30 yrs
- Wildfire 1/10 Low
- Heat 3/10 Moderate 7 d/yr ≥101°F today · 18 d/yr by 30 yrs out
- Wind 2/10 Low 100% chance of damaging wind over 30 yrs
- Air quality 2/10 Low 2 unhealthy d/yr today · 2 by 30 yrs out
Nearby sold comps map
Loading sold comps map…
Walkable amenities ~0.75 mi
Loading nearby amenities…
Taxation est. · year 1
- Rental income
- $28,412
- − Mortgage interest
- −$16,749
- − Property taxes
- −$2,024
- − Insurance
- −$1,495
- − Repairs & maintenance
- −$2,273
- − Management
- −$2,273
- − HOA
- −$456
- − Depreciation
- −$8,698
- Taxable loss
- −$5,556
- Est. tax savings @ 24.0%
- +$1,333
- After-tax cash flow
- $988/yr
For passive investors: Depreciation is non-cash, so a rental often shows a tax loss while cash-flowing — sheltering income. Rental losses are passive: they offset passive income freely, and up to $25,000/yr can offset ordinary (W-2) income if you actively participate and your MAGI is under $100k (phasing out to $0 by $150k); unused losses carry forward. On sale, claimed depreciation is recaptured at up to 25%, and gains may owe capital-gains tax (a 1031 exchange can defer both). Figures are a year-1 estimate at your 24.0% rate — not tax advice; consult a CPA.
Schools (NCES district)
- District
- South Madison Community School Corporation
- NCES district ID
- 1810440
- Math proficiency
- 44% ▼ -13.00%
- Reading proficiency
- 52% ▼ -6.00%
- Median HH income
- $63,565
- Composite
- 42.4/100
- National rank
- #3231
- State rank
- #60 of 301 in IN
Livability — Ingalls
- Score
- 64/100
- State rank
- #391
- US rank
- #14479
Category grades
Schools grade is shown separately in the Schools card above.
Census & demographics
- City population
- 2,209
- Population (ZIP)
- 17,730
Population outlook (Madison County) Hauer SSP2
- Today (2025)
- 125,800 people
- By 2030
- 122,640 · -2.5%
- By 2040
- 115,420 · -8.3%
- By 2050
- 108,148 · -14.0%
- By 2075
- 91,838 · -27.0%
- By 2100
- 75,670 · -39.8%
Race, ethnicity, and origin ACS 2023
- Neighborhood character
- Predominantly White (86%)
- Race & ethnicity
- White 86% Two or more races 6% Black 5% Hispanic / Latino 3% Asian 1%
- Common ancestry
- Slovak 3% Italian 2% Romanian 1%
- Foreign-born
- 2% · Canada
- Languages at home
- 96% English-only · Spanish 2% Other Indo-European 1%
Political lean MEDSL · Madison
- 2024 margin
- Strong R (+26.9) · D 35.6% · R 62.5% · Other 1.9%
- 2008→2024 swing
- -33.5pp toward R · 2008: 6.5pp · 2024: -26.9pp
- All cycles
- 2024: R+26.9 2020: R+22.6 2016: R+25.7 2012: R+4.5 2008: D+6.5
Not yet ingested
- Civics
- —
Market trends
- HPI YoY
- ▼ -160.39%
- Current HPI
- 227.4921
- Rent YoY
- —
- Metro
- —
- State GDP YoY
- ▲ 2.90%
- F500 in state
- 18
Industry mix (Fortune 500 HQ in IN)
| Industry | F500 HQs | Revenue |
|---|---|---|
| Industrial Machinery | 2 | $37B |
|
||
| Healthcare | 1 | $177B |
|
||
| Pharmaceuticals | 1 | $45B |
|
||
| Metals / Steel | 1 | $18B |
|
||
| Agriculture | 1 | $17B |
|
||
| Packaging | 1 | $12B |
|
||
Price history
+131.5% since first listed23 events — show timeline
- 2026-05-14 Price Changed $307,000 MIBOR as Distributed by MLS Grid
- 2026-04-30 Listed $310,000 MIBOR as Distributed by MLS Grid
- 2026-04-17 Sold (Public Records) $296,800 Public Records
- 2017-01-20 Sold (MLS) $146,330 MIBOR as Distributed by MLS Grid
- 2016-12-22 Pending — MIBOR as Distributed by MLS Grid
- 2016-11-19 Listed $145,000 MIBOR as Distributed by MLS Grid
- 2014-04-14 Listing Removed — MIBOR as Distributed by MLS Grid
- 2014-04-01 Sold (MLS) $129,000 MIBOR as Distributed by MLS Grid
- 2014-01-20 Listed $129,900 MIBOR as Distributed by MLS Grid
- 2013-05-14 Listing Removed — MIBOR as Distributed by MLS Grid
- 2012-11-16 Listing Removed — MIBOR as Distributed by MLS Grid
- 2012-11-16 Listed $129,000 MIBOR as Distributed by MLS Grid
- 2012-05-16 Listed $129,000 MIBOR as Distributed by MLS Grid
- 2011-03-02 Listing Removed — MIBOR as Distributed by MLS Grid
- 2010-08-31 Listed $134,000 MIBOR as Distributed by MLS Grid
- 2010-05-04 Listing Removed — MIBOR as Distributed by MLS Grid
- 2009-06-10 Listing Removed — MIBOR as Distributed by MLS Grid
- 2009-06-09 Listed $141,000 MIBOR as Distributed by MLS Grid
- 2009-03-11 Listed $150,000 MIBOR as Distributed by MLS Grid
- 2009-01-22 Listing Removed — MIBOR as Distributed by MLS Grid
- 2008-01-21 Listed $139,900 MIBOR as Distributed by MLS Grid
- 2006-02-14 Listed $133,040 MIBOR as Distributed by MLS Grid
- 2006-02-14 Sold (MLS) $132,605 MIBOR as Distributed by MLS Grid
Property tax history
+8.4%/yrLatest (2024): $2,024 · -0.1% YoY. Source: county tax records.
Cash-flow waterfall
monthlySold comps — $/sqft
last 12 mo · ≤1 miLoading sold comps…