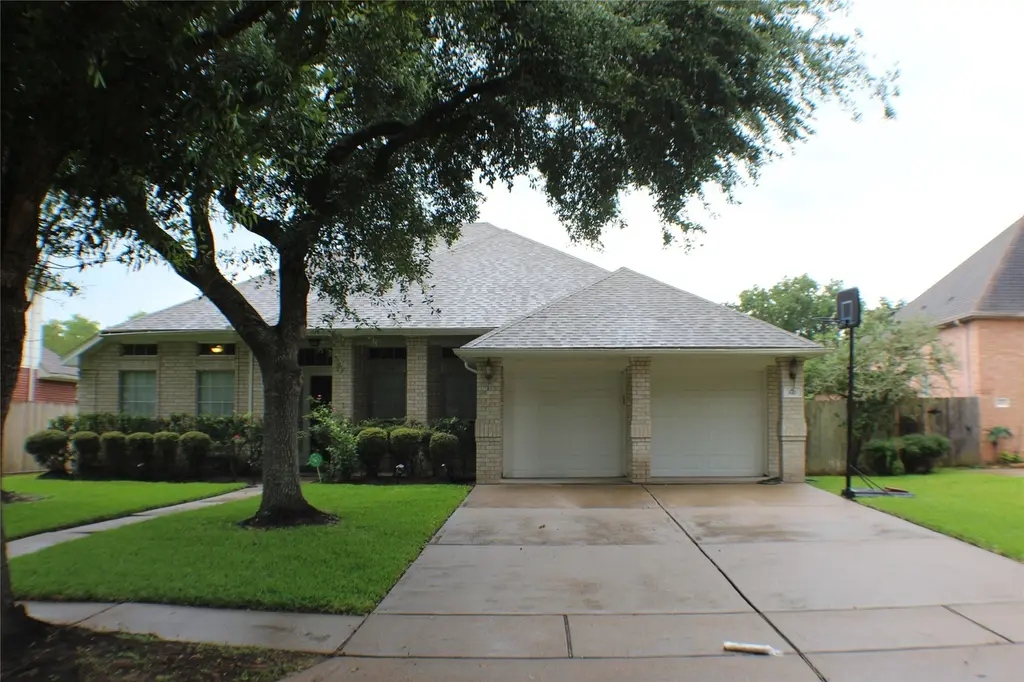
610 High Meadows Dr
Sugar Land, TX 77479
$369,000D+
3 bd · 2.0 ba ·
2,205 sqft ·
Built 1995
· SingleFamily
· Active
· 19 DOM
Cashflow @ list (25.0% down · 7.5%)
Estimated rent
$3,886/mo
Mortgage (P&I)
−$1,935
Tax + insurance
−$768
HOA
−$107
Vac / Maint / Mgmt
−$816
Net cashflow
$260/mo
Annual
$3,117/yr
Cap rate
7.14%
Cash-on-cash
3.02%
DSCR
1.13
1% rule
1.05%
Cash to close
$103,320
Investor read
- This is a 3-bed/2.0-bath single-family listed at $369k.
- At list price, monthly cash flow is $260 ($3k/yr) — positive.
- The deal already cash-flows at list — no discount required.
- Meets the 1% rule at list price ($4k rent vs $369k).
- It's been on market 19 days — a 2% lower offer ($363k) is reasonable based on typical stale-listing flexibility.
- Recommended offer: $363k (1.5% below list) — sets the bar for market timing.
- Local home prices are declining (-3.0%/yr); year-one equity from $3k of loan paydown is wiped out by about $11k of value loss. Plan a longer hold.
- Location reads 80/100 on livability (#38 in TX, #1,758 nationally) — a professional / high-income tenant draw. Strengths: crime A+, employment A+, housing A+; Watch: cost of living D, commute F.
- Fort Bend ISD (suburban): math 44% / reading 53% proficiency, ranked #140 of 826 in TX (top 17%) — families likely to look elsewhere, expect single-tenant / working-renter base with shorter leases.
- Zoned schools: Brazos Bend El (math 47% / reading 54%, grade D+, #833 of 4,322 statewide, top 20%, 739 students, 44% FRL); Sartartia Middle (math 69% / reading 71%, grade A, #58 of 1,662 statewide, top 4%, 1,440 students, 24% FRL) — zoned schools at 34% FRL track the district average.
- Market conditions: Rents flat; 553 active listings in the ZIP; 2 comparable units currently listed for rent nearby; high-income renter base; 12,093 units permitted in Fort Bend County in 2024 (815 in 5+ unit buildings).
- Fort Bend County population projected at +75% by 2050 — long-run rental-demand tailwind backs the buy-and-hold thesis.
- 2 sale attempts since 17y ago with the ask held roughly flat each time — persistent listings suggest the price (not the market) is what's stuck; bring a comps-based counter.
- Climate carrying-cost: moderate flood risk; severe wind risk, 99% chance of damaging wind over 30y; extreme-heat days projected 7→23/yr by 2055 (HVAC capex compounding) — expect insurance premiums to compound above CPI over the hold.
- Cap rate 7.1% vs local median 2.6% in Sugar Land — top-decile yield for the area; either an underpriced asset or a hidden risk that comps aren't pricing in. Stress-test before assuming the spread holds.
Questions for listing agent
- What does the HOA fee cover, when was the last increase, and are there any pending special assessments or reserve-fund shortfalls?
- Is there a deadline driving the sale (1031 exchange, divorce, estate, relocation)? That informs how much negotiation room exists.
- Schools are A-rated — typically a magnet for longer-tenancy family renters. What's the average tenant stay here, and is there a school-zone premium baked into asking?
- The area grade is low — what's the realistic commute time and amenity access for the typical tenant pool here? Any planned neighborhood developments (good or bad) we should know about?
- What's the average days-on-market for RENTAL listings here right now (not sales)? A rising rental-DOM trend means longer vacancies and softer asking-rent achievability than the comps imply.
- What's the recent tenant-quality profile in this submarket — average credit score on applications, eviction rate, late-payment / NSF rate, and stable-employment percentage? A property-management company in the area should have these aggregated.
- How much new for-sale + rental construction is in the pipeline within 1–3 miles? Heavy new supply typically softens prices + rents 12–24 months out; constrained supply supports both.
CashFlowRE · CFR-KSACNG4X9EKACB
· Data 2 days ago
cashflowre.app · 2026-05-29