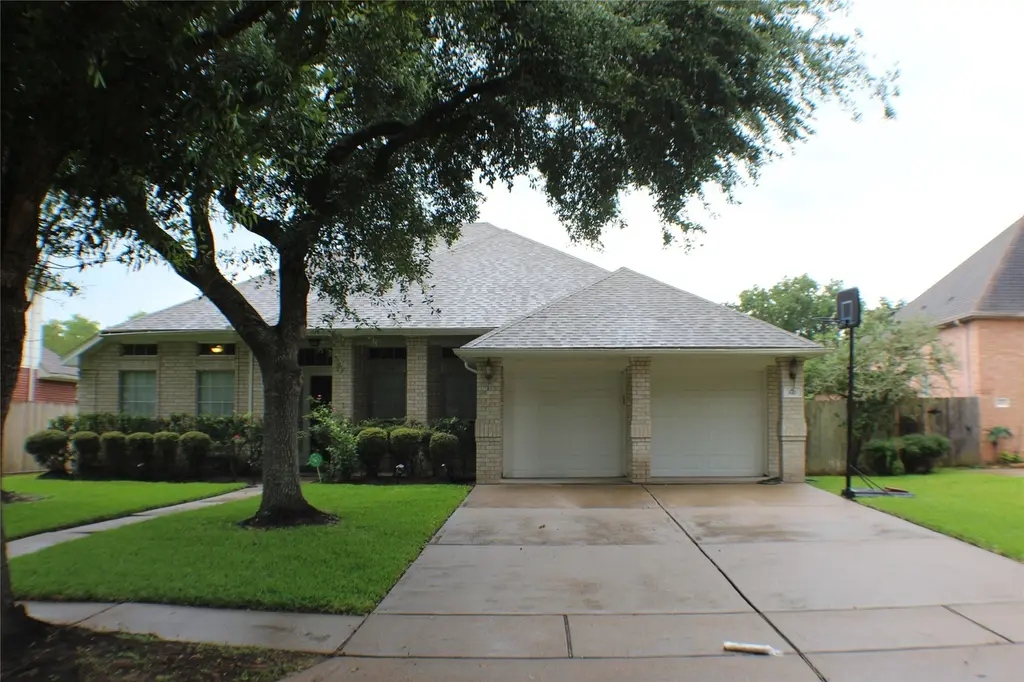
610 High Meadows Dr · Sugar Land, TX
Flood risk 5/10 · Moderate
- FEMA flood zone
- X
- Chance of flooding over 30 yrs
- 0.67%
- Est. flood insurance / yr
- $507 – $1,088
Fire risk 1/10 · Minimal
- Est. fire insurance / yr
- $1,222 – $2,270
Heat risk 9/10 · Severe
- Hot days now (above 110°F)
- 7 days/yr
- Hot days in 30 yrs
- 23 days/yr
Wind risk 9/10 · Severe
- Chance of severe wind over 30 yrs
- 99.0%
Air-quality risk 2/10 · Minimal
- Unhealthy air days now
- 1 days/yr
- Unhealthy air days in 30 yrs
- 2 days/yr
Risk factors via First Street. Map © Google.
Why this score? — see what drove the D+ grade
The composite is a weighted blend of 9 inputs, each scored 0–100. Each bar is that input's sub-score; the figure is the points it added to the 100-point composite (weight × sub-score).
- Cash flow +17.1/30.0
- 1% rule +5.5/10.0
- ARV discount +5.4/15.0
- DSCR +5.3/10.0
- Schools +4.5/10.0
- Livability +4.0/5.0
- Rent growth +2.7/5.0
- Condition / age +2.5/5.0
- Appreciation +0.0/10.0
$369,000
🖨 Deal sheet 📄 Offer letter ✓ Due diligence
Listing remarks MLS
STOP, You'll love this home! Everything is done, just move in. Beautiful one story Home in new Territory. The Owners updated every single Room in this cute house, with wood, granite, appliances and much more. Enjoy 4 beds, 2 baths, hard wood floors, a fire place, formal living and dining room and a great Master Bedroom. Come and see for yourself. Close to parks, lakes & schools on a quiet street.
Key facts
- One story house
- Huge family room
- Welcoming entry
Tags
Property features AI
Finance
- HOA & community: Homeowners association (NTRCA) with annual fee covering recreation facilities; Community pool
Exterior
- Parking: Attached garage (2 spaces)
- Utilities: Public water; Public sewer
- Home design: Residential property; Single-story (entry level: first floor)
- Construction: Brick construction; Built in 1995; Composition roof; Slab foundation
- Exterior features: Located in a subdivision
Interior
- Kitchen: Dishwasher; Electric oven; Free-standing range; Gas range; Microwave; Oven
- Bedrooms: Primary bedroom, first floor (16x15); Bedroom, first floor (11x14); Bedroom, first floor (14x10); Bedroom, first floor (10x11)
- Bathrooms: 2 full bathrooms
- Heating & cooling: Central heating (gas); Central air conditioning (electric)
- Interior features: Kitchen island; Wood-burning fireplace (1)
- Laundry & utility: Washer hookup; Electric dryer hookup
Neighborhood map
What this means for you Summary
Snapshot
- This is a 3-bed/2.0-bath single-family listed at $369k.
Deal economics
- At list price, monthly cash flow is $260 ($3k/yr) — positive.
- The deal already cash-flows at list — no discount required.
- Meets the 1% rule at list price ($4k rent vs $369k).
- Recommended offer: $363k (1.5% below list) — sets the bar for market timing.
- Cap rate 7.1% vs local median 2.6% in Sugar Land — top-decile yield for the area; either an underpriced asset or a hidden risk that comps aren't pricing in. Stress-test before assuming the spread holds.
Location & tenants
- Location reads 80/100 on livability (#38 in TX, #1,758 nationally) — a professional / high-income tenant draw. Strengths: crime A+, employment A+, housing A+; Watch: cost of living D, commute F.
- Fort Bend ISD (suburban): math 44% / reading 53% proficiency, ranked #140 of 826 in TX (top 17%) — families likely to look elsewhere, expect single-tenant / working-renter base with shorter leases.
- Zoned schools: Brazos Bend El (math 47% / reading 54%, grade D+, #833 of 4,322 statewide, top 20%, 739 students, 44% FRL); Sartartia Middle (math 69% / reading 71%, grade A, #58 of 1,662 statewide, top 4%, 1,440 students, 24% FRL) — zoned schools at 34% FRL track the district average.
- Market conditions: Rents flat; 553 active listings in the ZIP; 2 comparable units currently listed for rent nearby; high-income renter base; 12,093 units permitted in Fort Bend County in 2024 (815 in 5+ unit buildings).
Forward outlook
- Local home prices are declining (-3.0%/yr); year-one equity from $3k of loan paydown is wiped out by about $11k of value loss. Plan a longer hold.
- Fort Bend County population projected at +75% by 2050 — long-run rental-demand tailwind backs the buy-and-hold thesis.
Negotiation context
- It's been on market 19 days — a 2% lower offer ($363k) is reasonable based on typical stale-listing flexibility.
- 2 sale attempts since 17y ago with the ask held roughly flat each time — persistent listings suggest the price (not the market) is what's stuck; bring a comps-based counter.
Risks & watch-outs
- Climate carrying-cost: moderate flood risk; severe wind risk, 99% chance of damaging wind over 30y; extreme-heat days projected 7→23/yr by 2055 (HVAC capex compounding) — expect insurance premiums to compound above CPI over the hold.
Questions for the listing agent
- What does the HOA fee cover, when was the last increase, and are there any pending special assessments or reserve-fund shortfalls?
- Is there a deadline driving the sale (1031 exchange, divorce, estate, relocation)? That informs how much negotiation room exists.
- Schools are A-rated — typically a magnet for longer-tenancy family renters. What's the average tenant stay here, and is there a school-zone premium baked into asking?
- The area grade is low — what's the realistic commute time and amenity access for the typical tenant pool here? Any planned neighborhood developments (good or bad) we should know about?
- What's the average days-on-market for RENTAL listings here right now (not sales)? A rising rental-DOM trend means longer vacancies and softer asking-rent achievability than the comps imply.
- What's the recent tenant-quality profile in this submarket — average credit score on applications, eviction rate, late-payment / NSF rate, and stable-employment percentage? A property-management company in the area should have these aggregated.
- How much new for-sale + rental construction is in the pipeline within 1–3 miles? Heavy new supply typically softens prices + rents 12–24 months out; constrained supply supports both.
Investment metrics
- 1% rule
- 1.05% ✓
- Cap rate
- 7.14%
- Cash-on-cash
- 3.02%
- DSCR
- 1.13
- GRM
- 7.9
CMA / ARV
- ARV (on-the-fly)
- $352,800
- Comps found
- 12
Show comp detail 12 sales within ~0.75 mi
| Address | Dist | Beds/Ba | Sqft | Sold | Price | $/sf | Match |
|---|---|---|---|---|---|---|---|
| 818 Presley Way | 0.26mi | 3/2.0 | 2,049 (-7%) | 6mo | $335,000 | $163 | 71 |
| 918 Featherbrook Ct | 0.36mi | 4/2.5 (+1) | 2,251 (+2%) | 2mo | $311,000 | $138 | 71 |
| 4211 W Meadows Dr | 0.43mi | 3/2.5 | 2,286 (+4%) | 3mo | $339,500 | $149 | 69 |
| 126 Selkirk Dr | 0.51mi | 3/2.5 | 2,286 (+4%) | 0mo | $350,000 | $153 | 68 |
| 318 High Meadows Dr | 0.24mi | 3/2.0 | 2,416 (+10%) | 6mo | $370,000 | $153 | 68 |
| 4211 Margate Dr | 0.50mi | 3/2.5 | 2,286 (+4%) | 2mo | $365,000 | $160 | 67 |
| 4415 Casey Cir | 0.29mi | 4/2.5 (+1) | 2,336 (+6%) | 4mo | $388,000 | $166 | 66 |
| 4222 W Meadows Dr | 0.39mi | 3/2.0 | 1,910 (-13%) | 1mo | $350,000 | $183 | 59 |
| 102 Lindencrest Ct | 0.70mi | 4/2.5 (+1) | 2,273 (+3%) | 1mo | $350,000 | $154 | 55 |
| 4106 N New Meadows Dr | 0.47mi | 3/2.0 | 1,896 (-14%) | 2mo | $325,000 | $171 | 53 |
| 1114 Foxland Chase St | 0.65mi | 4/2.0 (+1) | 2,315 (+5%) | 5mo | $369,000 | $159 | 52 |
| 119 Lissa Ln | 0.66mi | 3/2.0 | 1,950 (-12%) | 1mo | $315,000 | $162 | 49 |
Match score weights: distance 35% · size 25% · config 20% · recency 20%. Top-matched comps best support the ARV.
Projected returns pro-forma
-3.0% appreciation · 0.82% rent growth · sell at horizon
- IRR
- -14.2%
- Equity multiple
- 0.50×
- Total profit
- $-51,375
- Equity at exit
- $55,019
- IRR
- -9.8%
- Equity multiple
- 0.46×
- Total profit
- $-55,318
- Equity at exit
- $31,904
Cash invested: $103,320 (down + closing). Projections, not guarantees.
Landlord ↔ Tenant lean methodology
- Overall (STATE)
- 87 Strongly Landlord-Friendly
- State Texas
- 87 Strongly Landlord-Friendly · R+5
- County
- — inherits STATE
- City
- — inherits STATE
ZIP-level market 77479
- Home prices YoY
- -34.9%
- Rents YoY
- 0.8%
- Active inventory
- 553
- Price-to-rent
- 7.9×
Monthly cashflow live
- Estimated rent
- $3,886 medium interval (Pro) →
- Mortgage (P&I)
- −$1,935
- Tax from tax record
- −$615 /mo · $7,375/yr
- Insurance
- −$154
- HOA
- −$107
- Vacancy / Maint / Mgmt
- −$816
- Net cashflow
- $260
Break-even live
UW: 25.0% down · 7.5% · 30yr · 1.5% tax · 5.0% vac · 8.0% maint · 8.0% mgmt
Financing live
Cash to close
- Down payment
- $92,250
- Closing costs
- $11,070
- Reserves months
- —
- Total cash needed
- —
Loan-product check · same deal, 3 products live
Conventional
25% down · 7.5% · 30yr
- Down + closing
- —
- Monthly P&I
- —
- Monthly cashflow
- —
- DSCR
- —
- Eligible?
- —
Personal DTI + credit; lowest rate.
DSCR
20% down · 8.5% · 30yr
- Down + closing
- —
- Monthly P&I
- —
- Monthly cashflow
- —
- DSCR
- —
- Eligible?
- —
No personal income docs; deal must DSCR.
Hard money
10% down · 12.0% · 12mo
- Down + closing
- —
- Monthly P&I
- —
- Monthly cashflow
- —
- DSCR
- —
- Eligible?
- —
Short-term bridge; refi at stabilization.
Rent comps 2 comps
| Address | Beds | Baths | Sqft | Rent | $/sqft | DOM | Units | Dist |
|---|---|---|---|---|---|---|---|---|
| 4315 Trailwood Dr Sugar Land, TX | 4.0 | 2.5 | 2250 | $5,800 | $2.58 | 12d | 1 | 0.21mi |
| 107 High Meadows Dr Sugar Land, TX | 4.0 | 3.0 | 2619 | $2,600 | $0.99 | 43d | 1 | 0.50mi |
HOA detail
- Monthly dues
- $107 · $1,284/yr
Listing history 14 events
-
2026-06-18days on market $369,000 Active 19 DOM
-
2026-06-17days on market $369,000 Active 18 DOM
-
2026-06-16days on market $369,000 Active 17 DOM
-
2026-06-15days on market $369,000 Active 16 DOM
-
2026-06-13days on market $369,000 Active 14 DOM
-
2026-06-09days on market $369,000 Active 10 DOM
-
2026-06-08days on market $369,000 Active 9 DOM
-
2026-06-07days on market $369,000 Active 8 DOM
-
2026-06-04days on market $369,000 Active 5 DOM
-
2026-06-03days on market $369,000 Active 4 DOM
-
2026-06-02days on market $369,000 Active 3 DOM
-
2026-06-01days on market $369,000 Active 2 DOM
-
2026-05-31remarks 217-char remark
-
2026-05-31$369,000 Active 1 DOM
ⓘ Source: listings_history table (triggers on properties + properties_extension) + one-shot
backfill from property_details.listing_events for pre-trigger history.
Tax reassessment forecast TX · Resets to sale price
- Current annual tax
- $7,375 · $615/mo
- Projected year-2 tax
- $7,375 · $615/mo
- Expected delta
- $0/yr ($0/mo · 0.0%)
ⓘ Screening estimate from a state-policy table — verify with the county assessor before closing.
Climate risk First Street
- Flood 5/10 Major FEMA zone X · 67% chance over 30 yrs
- Wildfire 1/10 Low
- Heat 9/10 Extreme 7 d/yr ≥110°F today · 23 d/yr by 30 yrs out
- Wind 9/10 Extreme 99% chance of damaging wind over 30 yrs
- Air quality 2/10 Low 1 unhealthy d/yr today · 2 by 30 yrs out
Nearby sold comps map
Loading sold comps map…
Walkable amenities ~0.75 mi
Loading nearby amenities…
Taxation est. · year 1
- Rental income
- $46,636
- − Mortgage interest
- −$20,670
- − Property taxes
- −$7,375
- − Insurance
- −$1,845
- − Repairs & maintenance
- −$3,731
- − Management
- −$3,731
- − HOA
- −$1,284
- − Depreciation
- −$10,735
- Taxable loss
- −$2,735
- Est. tax savings @ 24.0%
- +$656
- After-tax cash flow
- $3,773/yr
For passive investors: Depreciation is non-cash, so a rental often shows a tax loss while cash-flowing — sheltering income. Rental losses are passive: they offset passive income freely, and up to $25,000/yr can offset ordinary (W-2) income if you actively participate and your MAGI is under $100k (phasing out to $0 by $150k); unused losses carry forward. On sale, claimed depreciation is recaptured at up to 25%, and gains may owe capital-gains tax (a 1031 exchange can defer both). Figures are a year-1 estimate at your 24.0% rate — not tax advice; consult a CPA.
Schools (NCES district)
- District
- Fort Bend ISD
- NCES district ID
- 4819650
- Math proficiency
- 44% ▼ -15.00%
- Reading proficiency
- 53% ▼ -4.00%
- Median HH income
- $82,360
- Composite
- 44.61/100
- National rank
- #2779
- State rank
- #140 of 826 in TX
Livability — Sugar Land
- Score
- 80/100
- State rank
- #38
- US rank
- #1758
Category grades
Schools grade is shown separately in the Schools card above.
Census & demographics
- Census place
- Sugar Land, TX
- County
- Fort Bend County · 836,777 people
- City population
- 168,209
- Metro
- Houston-The Woodlands-Sugar Land, TX
- Population (ZIP)
- 92,221
- Household income
- $156,735
- Rent vs Own
- Severe rent burden
- 1207.0
Population outlook (Fort Bend County) Hauer SSP2
- Today (2025)
- 1,004,526 people
- By 2030
- 1,153,104 · +14.8%
- By 2040
- 1,453,718 · +44.7%
- By 2050
- 1,753,781 · +74.6%
- By 2075
- 2,455,772 · +144.5%
- By 2100
- 2,930,528 · +191.7%
Race, ethnicity, and origin ACS 2023
- Neighborhood character
- Diverse neighborhood (Simpson 0.67)
- Race & ethnicity
- Asian 47% White 30% Hispanic / Latino 10% Black 8% Two or more races 8%
- Hispanic origin (detail)
- Mexican 5%
- Common ancestry
- Lithuanian 2% Romanian 1% Slovak 1%
- Foreign-born
- 42% · China, Canada, Vietnam
- Languages at home
- 52% English-only · Other Indo-European 16% Chinese 13% Spanish 6%
Political lean MEDSL · Fort Bend
- 2024 margin
- Toss-up / Even · D 49.5% · R 47.9% · Other 2.6%
- 2008→2024 swing
- +4.0pp toward D · 2008: -2.4pp · 2024: 1.6pp
- All cycles
- 2024: D+1.6 2020: D+10.6 2016: D+6.6 2012: R+6.8 2008: R+2.4
Not yet ingested
- Civics
- —
Market trends
- HPI YoY
- ▼ -121.96%
- Current HPI
- 227.7544
- Rent YoY
- ▲ 0.82%
- Metro
- Houston-The Woodlands-Sugar Land, TX
- State GDP YoY
- ▲ 3.95%
- F500 in state
- 110
Industry mix (Fortune 500 HQ in TX)
| Industry | F500 HQs | Revenue |
|---|---|---|
| Energy | 16 | $1,198B |
|
||
| Technology | 5 | $198B |
|
||
| Engineering / Construction | 4 | $72B |
|
||
| Energy Services | 3 | $60B |
|
||
| Utilities | 3 | $41B |
|
||
| Healthcare | 2 | $330B |
|
||
Price history
+84.7% since first listed12 events — show timeline
- 2026-05-30 Listed $369,000 HARMLS
- 2015-11-03 Sold (Public Records) — Public Records
- 2015-11-03 Sold (Public Records) — Public Records
- 2009-07-27 Sold (Public Records) — Public Records
- 2009-07-27 Sold (Public Records) — Public Records
- 2009-07-20 Sold (MLS) — HARMLS
- 2009-06-04 Listing Removed — HARMLS
- 2009-05-15 Listed $199,800 HARMLS
- 2008-05-16 Sold (Public Records) — Public Records
- 2002-04-30 Sold (Public Records) — Public Records
- 1996-05-10 Sold (Public Records) — Public Records
- 1995-04-20 Sold (Public Records) — Public Records
Property tax history
+3.4%/yrLatest (2025): $7,375 · +10.7% YoY. Source: county tax records.
Cash-flow waterfall
monthlySold comps — $/sqft
last 12 mo · ≤1 miLoading sold comps…