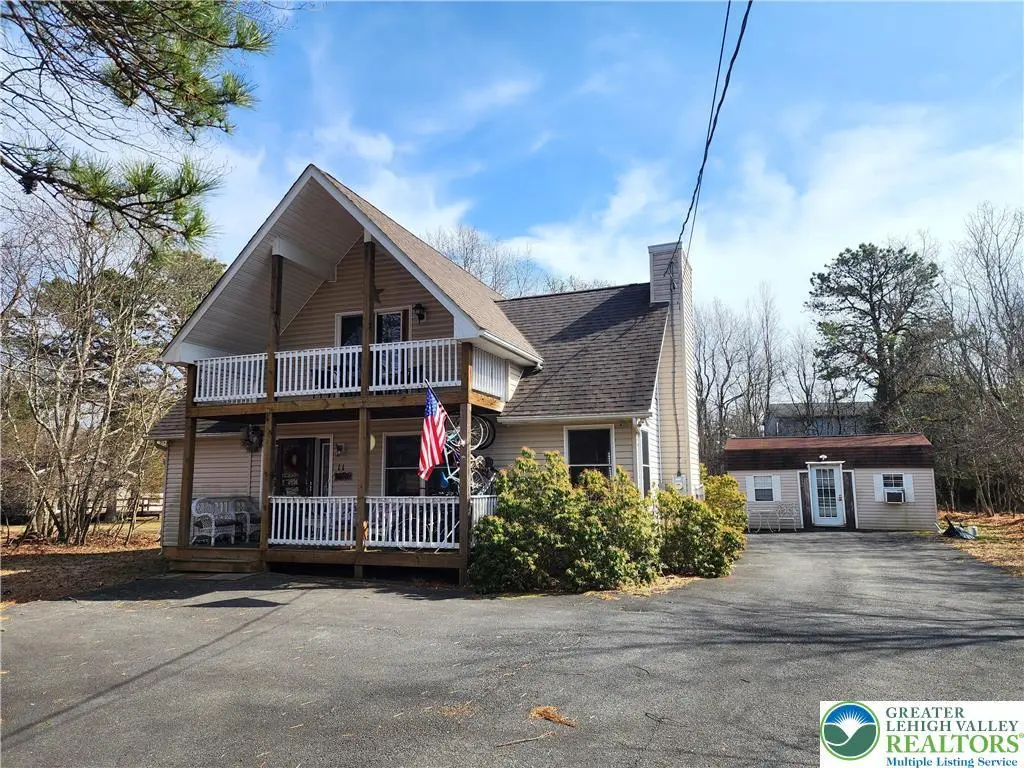
11 Bishop Cir
Penn Forest, PA 18210
$329,000D-
3 bd · 2.5 ba ·
2,018 sqft ·
Built 2006
· SingleFamily
· Active
· 145 DOM
Cashflow @ list (25.0% down · 7.5%)
Estimated rent
$2,248/mo
Mortgage (P&I)
−$1,725
Tax + insurance
−$529
HOA
−$56
Vac / Maint / Mgmt
−$472
Net cashflow
$-535/mo
Annual
$-6,415/yr
Cap rate
4.34%
Cash-on-cash
-6.96%
DSCR
0.69
1% rule
0.68%
Cash to close
$92,120
Investor read
- This is a 3-bed/2.5-bath single-family listed at $329k.
- At list price, monthly cash flow is $-535 ($-6k/yr) — negative.
- To cash-flow at today's rent, offer at most $235k (28.7% below list).
- To meet the 1% rule (rent ≥ 1% of price), the offer needs to be $225k (31.7% below list).
- It's been on market 145 days — a 12% lower offer ($290k) is reasonable based on typical stale-listing flexibility.
- Recommended offer: $225k (31.7% below list) — sets the bar for 1% rule.
- Local home prices are declining (-2.9%/yr); year-one equity from $2k of loan paydown is wiped out by about $9k of value loss. Plan a longer hold.
- Location reads: area grade D — affects rentability + tenant quality, not the cash-flow math above.
- Jim Thorpe Area SD (rural): math 25% / reading 47% proficiency, ranked #394 of 539 in PA (top 73%) — families likely to look elsewhere, expect single-tenant / working-renter base with shorter leases.
- Zoned schools: Penn-Kidder Campus (math 18% / reading 45%, grade F, #1,112 of 1,518 statewide, top 73%, 571 students, 62% FRL); Jim Thorpe Area Hs (math 62% / reading 75%, grade B, #53 of 437 statewide, top 13%, 565 students, 45% FRL) — zoned schools average 54% FRL vs 38% district-wide (16 pts higher); higher-poverty schools than district average — tighter screening recommended.
- Zoned-school proficiency averages 50% at this address vs 36% district-wide (+14 pts) — the actual schools serving this property are materially stronger than the Jim Thorpe Area SD average implies; a family-tenant draw the district grade alone would hide.
- Market conditions: 457 active listings in the ZIP; 3 comparable units currently listed for rent nearby; rentals at typical pace (median 23d on market — plan ~3-4 weeks tenant-placement turnaround); 180 units permitted in Carbon County in 2024 (10 in 5+ unit buildings).
- Carbon County population projected at -18% by 2050 — secular population decline; favor cash flow + early exit over multi-decade hold.
- 7 sale attempts since 8y ago; this cycle's ask has dropped $51k (13%) from the opening price — seller is motivated, your offer sets the floor, not the list.
- Current owner paid $165k; list at $329k implies a 99% gain — meaningful room to come down on a strong offer.
Questions for listing agent
- What do current leases actually rent for vs. the listed asking? Can we see a recent rent roll and the last 12 months of T-12 income?
- It's been on market 145 days. Have you received any prior offers? Is the seller open to a 32% concession, seller financing, or rate buy-down credit?
- What does the HOA fee cover, when was the last increase, and are there any pending special assessments or reserve-fund shortfalls?
- Why hasn't it sold? Are there any deal-killer items the seller is aware of (foundation, flood, title, zoning, code violations)?
- Is there a deadline driving the sale (1031 exchange, divorce, estate, relocation)? That informs how much negotiation room exists.
- The area grade is low — what's the realistic commute time and amenity access for the typical tenant pool here? Any planned neighborhood developments (good or bad) we should know about?
- What's the average days-on-market for RENTAL listings here right now (not sales)? A rising rental-DOM trend means longer vacancies and softer asking-rent achievability than the comps imply.
- What's the recent tenant-quality profile in this submarket — average credit score on applications, eviction rate, late-payment / NSF rate, and stable-employment percentage? A property-management company in the area should have these aggregated.
CashFlowRE · CFR-KW8TCP2T4G192J
· Data 15 h ago
cashflowre.app · 2026-05-29