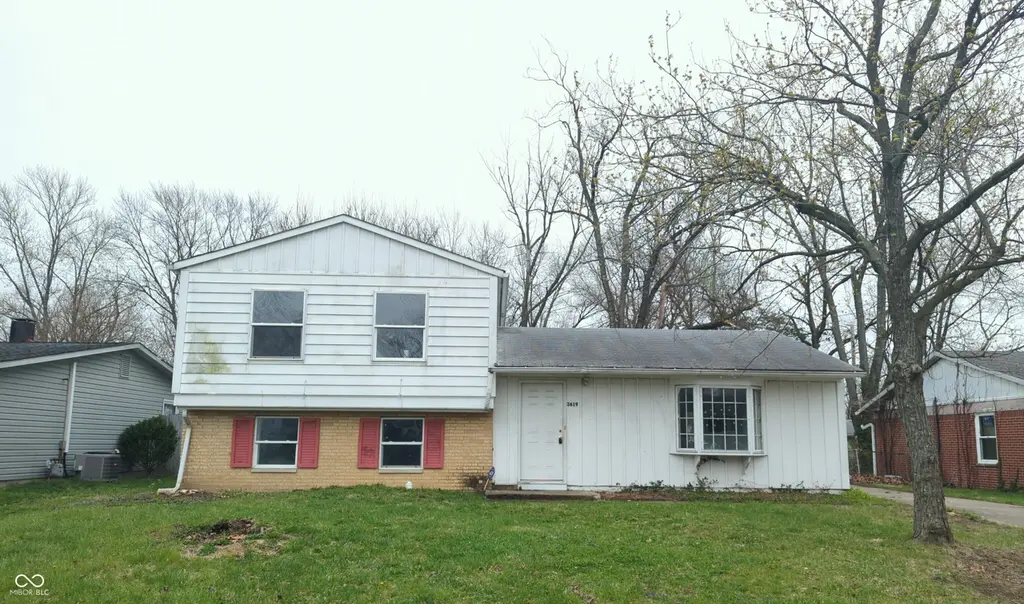
3619 Lori Ln
Indianapolis city (balance), IN 46226
$114,900B-
3 bd · 1.0 ba ·
1,616 sqft ·
Built 1960
· SingleFamily
· Pending
· 57 DOM
Cashflow @ list (25.0% down · 7.5%)
Estimated rent
$1,482/mo
Mortgage (P&I)
−$603
Tax + insurance
−$323
HOA
−$0
Vac / Maint / Mgmt
−$311
Net cashflow
$245/mo
Annual
$2,937/yr
Cap rate
8.85%
Cash-on-cash
9.13%
DSCR
1.41
1% rule
1.29%
Cash to close
$32,172
Investor read
- This is a 3-bed/1.0-bath single-family listed at $115k.
- At list price, monthly cash flow is $245 ($3k/yr) — positive.
- The deal already cash-flows at list — no discount required.
- Meets the 1% rule at list price ($1k rent vs $115k).
- It's been on market 57 days — a 3% lower offer ($111k) is reasonable based on typical stale-listing flexibility.
- Recommended offer: $111k (3.0% below list) — sets the bar for market timing.
- Local home prices are declining (-3.0%/yr); year-one equity from $794 of loan paydown is wiped out by about $3k of value loss. Plan a longer hold.
- Location reads: area grade B — affects rentability + tenant quality, not the cash-flow math above.
- Indianapolis Public Schools (urban): math 14% / reading 20% proficiency, ranked #286 of 301 in IN (top 95%) — low school quality limits family demand, transient renter base, plan for 1-2y turnover; 77% free/reduced lunch — lower-income household profile, screen leases tightly.
- Watch-outs: property tax is 2.9% of price.
- Market conditions: Rents rising fast (+6.8%/yr); 151 active listings in the ZIP; 22 comparable units currently listed for rent nearby; rentals at typical pace (median 18d on market — plan ~3-4 weeks tenant-placement turnaround); 1,906 units permitted in Marion County in 2024 (621 in 5+ unit buildings).
- Marion County population projected at +18% by 2050 — long-run rental-demand tailwind backs the buy-and-hold thesis.
- 2 sale attempts since 11y ago; this cycle's ask has dropped $10k (8%) from the opening price — seller is motivated, your offer sets the floor, not the list.
- Current owner paid $45k; list at $115k implies a 155% gain — meaningful room to come down on a strong offer.
- At projected returns (-3.0% appreciation + 6.8% rent growth), your $32k cash investment doubles in ~8 years — after that, you're playing with house money.
- Cap rate 8.8% vs local median 4.4% in Indianapolis city (balance) — top-decile yield for the area; either an underpriced asset or a hidden risk that comps aren't pricing in. Stress-test before assuming the spread holds.
- This rent runs 35% of the median local income ($50k/yr) — at the standard rent-burdened threshold; future hikes will face affordability resistance.
Questions for listing agent
- It's been on market 57 days. Have you received any prior offers? Is the seller open to a 3% concession, seller financing, or rate buy-down credit?
- Built in 1960 — when were the roof, HVAC, electrical panel, plumbing, and water heater last replaced?
- Property tax is high relative to price — has the assessment been appealed recently, and will the sale trigger a re-assessment?
- Is there a deadline driving the sale (1031 exchange, divorce, estate, relocation)? That informs how much negotiation room exists.
- What's the average days-on-market for RENTAL listings here right now (not sales)? A rising rental-DOM trend means longer vacancies and softer asking-rent achievability than the comps imply.
- What's the recent tenant-quality profile in this submarket — average credit score on applications, eviction rate, late-payment / NSF rate, and stable-employment percentage? A property-management company in the area should have these aggregated.
- How much new for-sale + rental construction is in the pipeline within 1–3 miles? Heavy new supply typically softens prices + rents 12–24 months out; constrained supply supports both.
CashFlowRE · CFR-KX3EPV21YMBZTP
· Data 1 week ago
cashflowre.app · 2026-05-29