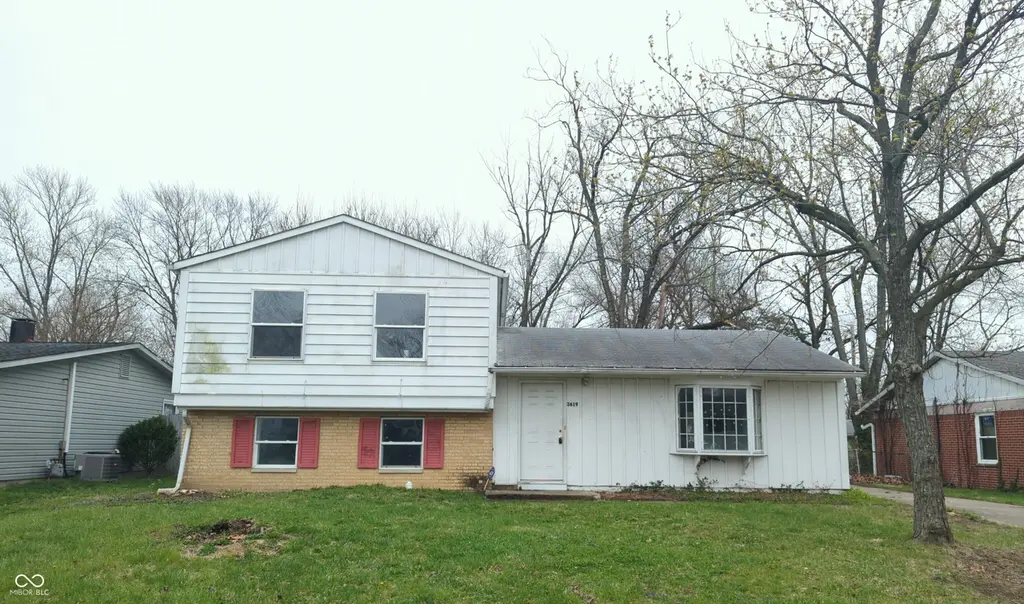
3619 Lori Ln · Indianapolis city (balance), IN
Flood risk 1/10 · Minimal
- FEMA flood zone
- X (unshaded)
- Chance of flooding over 30 yrs
- 0.0%
- Est. flood insurance / yr
- $507 – $1,088
Fire risk 1/10 · Minimal
- Est. fire insurance / yr
- $717 – $1,331
Heat risk 3/10 · Minor
- Hot days now (above 101°F)
- 7 days/yr
- Hot days in 30 yrs
- 18 days/yr
Wind risk 2/10 · Minimal
- Chance of severe wind over 30 yrs
- 0.0%
Air-quality risk 3/10 · Minor
- Unhealthy air days now
- 3 days/yr
- Unhealthy air days in 30 yrs
- 4 days/yr
Risk factors via First Street. Map © Google.
Why this score? — see what drove the B- grade
The composite is a weighted blend of 9 inputs, each scored 0–100. Each bar is that input's sub-score; the figure is the points it added to the 100-point composite (weight × sub-score).
- Cash flow +24.8/30.0
- ARV discount +15.0/15.0
- DSCR +8.1/10.0
- 1% rule +7.9/10.0
- Rent growth +4.2/5.0
- Livability +2.5/5.0
- Condition / age +2.5/5.0
- Schools +1.4/10.0
- Appreciation +0.0/10.0
$114,900
🖨 Deal sheet 📄 Offer letter ✓ Due diligence
Listing remarks MLS
Situated at 3619 Lori LN, INDIANAPOLIS, IN, USA, this single family residence presents a great opportunity for handy homeowners and astute investors alike. Within its 1616 square feet of living area, this residence provides 3 bedrooms and 1 bathroom on the upper level while having a large living space as you enter the home and a lower level space for a family/rec room. Constructed in 1960, this home is set upon a generous 9714 square feet lot with large back yard. The driveway is set up so a garage could be added. Huge potential and a must see!
Key facts
- 9,714 sq ft lot
- Built 1960
- Listed 57 days
Neighborhood map
What this means for you Summary
Snapshot
- This is a 3-bed/1.0-bath single-family listed at $115k.
Deal economics
- At list price, monthly cash flow is $245 ($3k/yr) — positive.
- The deal already cash-flows at list — no discount required.
- Meets the 1% rule at list price ($1k rent vs $115k).
- Recommended offer: $111k (3.0% below list) — sets the bar for market timing.
- Cap rate 8.8% vs local median 4.4% in Indianapolis city (balance) — top-decile yield for the area; either an underpriced asset or a hidden risk that comps aren't pricing in. Stress-test before assuming the spread holds.
Location & tenants
- Location reads: area grade B — affects rentability + tenant quality, not the cash-flow math above.
- Indianapolis Public Schools (urban): math 14% / reading 20% proficiency, ranked #286 of 301 in IN (top 95%) — low school quality limits family demand, transient renter base, plan for 1-2y turnover; 77% free/reduced lunch — lower-income household profile, screen leases tightly.
- Market conditions: Rents rising fast (+6.8%/yr); 151 active listings in the ZIP; 22 comparable units currently listed for rent nearby; rentals at typical pace (median 18d on market — plan ~3-4 weeks tenant-placement turnaround); 1,906 units permitted in Marion County in 2024 (621 in 5+ unit buildings).
- This rent runs 35% of the median local income ($50k/yr) — at the standard rent-burdened threshold; future hikes will face affordability resistance.
Forward outlook
- Local home prices are declining (-3.0%/yr); year-one equity from $794 of loan paydown is wiped out by about $3k of value loss. Plan a longer hold.
- Marion County population projected at +18% by 2050 — long-run rental-demand tailwind backs the buy-and-hold thesis.
- At projected returns (-3.0% appreciation + 6.8% rent growth), your $32k cash investment doubles in ~8 years — after that, you're playing with house money.
Negotiation context
- It's been on market 57 days — a 3% lower offer ($111k) is reasonable based on typical stale-listing flexibility.
- 2 sale attempts since 11y ago; this cycle's ask has dropped $10k (8%) from the opening price — seller is motivated, your offer sets the floor, not the list.
- Current owner paid $45k; list at $115k implies a 155% gain — meaningful room to come down on a strong offer.
Risks & watch-outs
- Watch-outs: property tax is 2.9% of price.
Questions for the listing agent
- It's been on market 57 days. Have you received any prior offers? Is the seller open to a 3% concession, seller financing, or rate buy-down credit?
- Built in 1960 — when were the roof, HVAC, electrical panel, plumbing, and water heater last replaced?
- Property tax is high relative to price — has the assessment been appealed recently, and will the sale trigger a re-assessment?
- Is there a deadline driving the sale (1031 exchange, divorce, estate, relocation)? That informs how much negotiation room exists.
- What's the average days-on-market for RENTAL listings here right now (not sales)? A rising rental-DOM trend means longer vacancies and softer asking-rent achievability than the comps imply.
- What's the recent tenant-quality profile in this submarket — average credit score on applications, eviction rate, late-payment / NSF rate, and stable-employment percentage? A property-management company in the area should have these aggregated.
- How much new for-sale + rental construction is in the pipeline within 1–3 miles? Heavy new supply typically softens prices + rents 12–24 months out; constrained supply supports both.
Investment metrics
- 1% rule
- 1.29% ✓
- Cap rate
- 8.85%
- Cash-on-cash
- 9.13%
- DSCR
- 1.41
- GRM
- 6.5
CMA / ARV
- ARV (median comp)
- $173,805
- List price
- $114,900
- Delta
- -33.89%
- Verdict
- UNDERPRICED
- Comps
- 20 within 1.0 mi
Show comp detail 12 sales within ~0.75 mi
| Address | Dist | Beds/Ba | Sqft | Sold | Price | $/sf | Match |
|---|---|---|---|---|---|---|---|
| 3663 Kline Dr N | 0.09mi | 3/1.0 | 1,720 (+6%) | 10mo | $200,000 | $116 | 76 |
| 7620 E 34th St | 0.25mi | 3/2.0 | 1,680 (+4%) | 7mo | $210,000 | $125 | 72 |
| 3659 N Mitchner Ave | 0.14mi | 4/1.5 (+1) | 1,700 (+5%) | 9mo | $195,000 | $115 | 70 |
| 7601 Ruskin Pl | 0.17mi | 4/1.5 (+1) | 1,700 (+5%) | 9mo | $200,000 | $118 | 69 |
| 3155 Roseway Dr | 0.64mi | 4/1.0 (+1) | 1,612 (-0%) | 11mo | $178,000 | $110 | 56 |
| 3630 Alsace Dr | 0.66mi | 3/1.0 | 1,722 (+7%) | 5mo | $185,000 | $107 | 54 |
| 3608 Tiffany Dr | 0.36mi | 4/2.0 (+1) | 1,788 (+11%) | 4mo | $218,500 | $122 | 54 |
| 3846 Alsace Pl | 0.75mi | 3/1.5 | 1,617 (+0%) | 12mo | $170,000 | $105 | 53 |
| 3531 Lombardy Pl | 0.65mi | 3/2.0 | 1,526 (-6%) | 7mo | $180,000 | $118 | 51 |
| 7257 E 38th St | 0.46mi | 4/1.5 (+1) | 1,813 (+12%) | 5mo | $120,000 | $66 | 47 |
| 3662 Lombardy Pl | 0.62mi | 3/1.5 | 1,428 (-12%) | 13mo | $184,000 | $129 | 39 |
| 3647 Richelieu Rd | 0.74mi | 4/1.5 (+1) | 1,421 (-12%) | 7mo | $155,000 | $109 | 33 |
Match score weights: distance 35% · size 25% · config 20% · recency 20%. Top-matched comps best support the ARV.
Projected returns pro-forma
-3.0% appreciation · 6.76% rent growth · sell at horizon
- IRR
- 2.2%
- Equity multiple
- 1.09×
- Total profit
- $2,893
- Equity at exit
- $17,132
- IRR
- 15.6%
- Equity multiple
- 2.52×
- Total profit
- $48,810
- Equity at exit
- $9,934
Cash invested: $32,172 (down + closing). Projections, not guarantees.
Landlord ↔ Tenant lean methodology
- Overall (STATE)
- 90 Strongly Landlord-Friendly
- State Indiana
- 90 Strongly Landlord-Friendly · R+11
- County
- — inherits STATE
- City
- — inherits STATE
ZIP-level market 46226
- Rents YoY
- 6.8%
- Active inventory
- 151
- Price-to-rent
- 6.5×
Monthly cashflow live
- Estimated rent
- $1,482 high interval (Pro) →
- Mortgage (P&I)
- −$603
- Tax from tax record
- −$275 /mo · $3,305/yr
- Insurance
- −$48
- HOA
- −$0
- Vacancy / Maint / Mgmt
- −$311
- Net cashflow
- $245
Break-even live
UW: 25.0% down · 7.5% · 30yr · 1.5% tax · 5.0% vac · 8.0% maint · 8.0% mgmt
Financing live
Cash to close
- Down payment
- $28,725
- Closing costs
- $3,447
- Reserves months
- —
- Total cash needed
- —
Loan-product check · same deal, 3 products live
Conventional
25% down · 7.5% · 30yr
- Down + closing
- —
- Monthly P&I
- —
- Monthly cashflow
- —
- DSCR
- —
- Eligible?
- —
Personal DTI + credit; lowest rate.
DSCR
20% down · 8.5% · 30yr
- Down + closing
- —
- Monthly P&I
- —
- Monthly cashflow
- —
- DSCR
- —
- Eligible?
- —
No personal income docs; deal must DSCR.
Hard money
10% down · 12.0% · 12mo
- Down + closing
- —
- Monthly P&I
- —
- Monthly cashflow
- —
- DSCR
- —
- Eligible?
- —
Short-term bridge; refi at stabilization.
Rent comps 22 comps
| Address | Beds | Baths | Sqft | Rent | $/sqft | DOM | Units | Dist |
|---|---|---|---|---|---|---|---|---|
| 7531 Penway St Indianapolis, IN | 3.0 | 1.5 | 1237 | $1,551 | $1.25 | 7d | 1 | 0.12mi |
| 3513 Roseway Dr Indianapolis, IN | 3.0 | 2.0 | 1216 | $1,600 | $1.32 | 17d | 1 | 0.33mi |
| 7937 E 34th St Indianapolis, IN | 4.0 | 1.0 | 1450 | $2,000 | $1.38 | 23d | 1 | 0.42mi |
| 7925 Crossbridge Dr Indianapolis, IN | 2.0 | 2.0 | 1072 | $1,200 | $1.12 | 43d | 1 | 0.44mi |
| 8203 Penway St Indianapolis, IN | 3.0 | 1.5 | 1360 | $1,500 | $1.10 | 23d | 1 | 0.52mi |
| 3775 Allerton Pl Indianapolis, IN | 1.0–4.0 | 2.0 | 1068 | $1,617 | $1.51 | 14d | 1 | 0.52mi |
| 3900 N Shadeland Ave Indianapolis, IN | 1.0–2.0 | 1.0 | 1070 | $1,075 | $1.00 | 3d | 6 | 0.86mi |
| 8254 Meadowlark Dr Indianapolis, IN | 3.0 | 1.5 | 1320 | $1,150 | $0.87 | 22d | 1 | 1.05mi |
| 8254 Meadowlark Dr Unit 1 Indianapolis, IN | 3.0 | 1.5 | 1320 | $1,150 | $0.87 | 43d | 1 | 1.05mi |
| 3540 Dubarry Ct Indianapolis, IN | 3.0 | 2.0 | 1297 | $1,400 | $1.08 | 23d | 1 | 1.07mi |
| 3815 Biscayne Rd Indianapolis, IN | 3.0 | 1.5 | 1188 | $1,220 | $1.03 | 14d | 1 | 1.07mi |
| 3821 Biscayne Rd Indianapolis, IN | 4.0 | 1.5 | 1188 | $1,325 | $1.12 | 14d | 1 | 1.07mi |
| 3823 Biscayne Rd Indianapolis, IN | 4.0 | 1.5 | 1188 | $1,320 | $1.11 | 14d | 1 | 1.07mi |
| 3829 Biscayne Rd Indianapolis, IN | 4.0 | 1.5 | 1188 | $1,320 | $1.11 | 14d | 1 | 1.08mi |
| 8501 Athens Ct Indianapolis, IN | 4.0 | 1.0 | 1225 | $1,475 | $1.20 | 14d | 1 | 1.12mi |
| 4315 Aspen Way Indianapolis, IN | 3.0 | 1.0 | 1080 | $1,380 | $1.28 | 43d | 1 | 1.14mi |
| 8738 Montery Rd Indianapolis, IN | 3.0 | 1.0 | 1421 | $1,396 | $0.98 | 7d | 1 | 1.15mi |
| 8862 Bel Air Ct Indianapolis, IN | 3.0 | 1.0 | 1073 | $1,264 | $1.18 | 17d | 1 | 1.19mi |
| 4176 N Irwin Ave Indianapolis, IN | 4.0 | 2.0 | 2006 | $1,595 | $0.80 | 22d | 1 | 1.24mi |
| 7845 Bonita Ct Indianapolis, IN | 3.0 | 1.0 | 1073 | $1,400 | $1.30 | 7d | 1 | 1.28mi |
| 8914 Elmonte Dr Indianapolis, IN | 3.0 | 1.5 | 1500 | $1,600 | $1.07 | 23d | 1 | 1.28mi |
| 7910 Roy Rd Indianapolis, IN | 3.0 | 1.0 | 1073 | $1,445 | $1.35 | 23d | 1 | 1.31mi |
Listing history 10 events
-
2026-06-07statusdays on market $114,900 Pending 57 DOM
-
2026-06-03days on market $114,900 Active 56 DOM
-
2026-06-02days on market $114,900 Active 55 DOM
-
2026-06-01days on market $114,900 Active 54 DOM
-
2026-05-31days on market $114,900 Active 53 DOM
-
2026-05-11price $114,900 554-char remark
Show marketing remark (554 chars)
Situated at 3619 Lori LN, INDIANAPOLIS, IN, USA, this single family residence presents a great opportunity for handy homeowners and astute investors alike. Within its 1616 square feet of living area, this residence provides 3 bedrooms and 1 bathroom on the upper level while having a large living space as you enter the home and a lower level space for a family/rec room. Constructed in 1960, this home is set upon a generous 9714 square feet lot with large back yard. The driveway is set up so a garage could be added. Huge potential and a must see!
-
2026-03-31$124,900 Active 554-char remark
Show marketing remark (554 chars)
Situated at 3619 Lori LN, INDIANAPOLIS, IN, USA, this single family residence presents a great opportunity for handy homeowners and astute investors alike. Within its 1616 square feet of living area, this residence provides 3 bedrooms and 1 bathroom on the upper level while having a large living space as you enter the home and a lower level space for a family/rec room. Constructed in 1960, this home is set upon a generous 9714 square feet lot with large back yard. The driveway is set up so a garage could be added. Huge potential and a must see!
-
2015-04-10soldstatus $45,000 Sold 176-char remark
Show marketing remark (176 chars)
What a great opportunity! The perfect investment or starter home. 3 bedrooms, newer windows and a huge fenced backyard. 3 levels for maximum space for everyone. Newer carpet.
-
2015-03-27historical Contingent - Backup Pending Home Inspection 176-char remark
Show marketing remark (176 chars)
What a great opportunity! The perfect investment or starter home. 3 bedrooms, newer windows and a huge fenced backyard. 3 levels for maximum space for everyone. Newer carpet.
-
2015-03-14$49,000 Active 176-char remark
Show marketing remark (176 chars)
What a great opportunity! The perfect investment or starter home. 3 bedrooms, newer windows and a huge fenced backyard. 3 levels for maximum space for everyone. Newer carpet.
ⓘ Source: listings_history table (triggers on properties + properties_extension) + one-shot
backfill from property_details.listing_events for pre-trigger history.
Tax reassessment forecast IN · Partial reset (capped growth)
- Current annual tax
- $3,305 · $275/mo
- Projected year-2 tax
- $3,305 · $275/mo
- Expected delta
- $0/yr ($0/mo · 0.0%)
ⓘ Screening estimate from a state-policy table — verify with the county assessor before closing.
Climate risk First Street
- Flood 1/10 Low FEMA zone X (unshaded) · 0% chance over 30 yrs
- Wildfire 1/10 Low
- Heat 3/10 Moderate 7 d/yr ≥101°F today · 18 d/yr by 30 yrs out
- Wind 2/10 Low 0% chance of damaging wind over 30 yrs
- Air quality 3/10 Moderate 3 unhealthy d/yr today · 4 by 30 yrs out
Nearby sold comps map
Loading sold comps map…
Walkable amenities ~0.75 mi
Loading nearby amenities…
Taxation est. · year 1
- Rental income
- $17,781
- − Mortgage interest
- −$6,436
- − Property taxes
- −$3,305
- − Insurance
- −$574
- − Repairs & maintenance
- −$1,423
- − Management
- −$1,423
- − Depreciation
- −$3,343
- Taxable income
- $1,278
- Est. tax owed @ 24.0%
- −$307
- After-tax cash flow
- $2,631/yr
For passive investors: Depreciation is non-cash, so a rental often shows a tax loss while cash-flowing — sheltering income. Rental losses are passive: they offset passive income freely, and up to $25,000/yr can offset ordinary (W-2) income if you actively participate and your MAGI is under $100k (phasing out to $0 by $150k); unused losses carry forward. On sale, claimed depreciation is recaptured at up to 25%, and gains may owe capital-gains tax (a 1031 exchange can defer both). Figures are a year-1 estimate at your 24.0% rate — not tax advice; consult a CPA.
Schools (NCES district)
- District
- Indianapolis Public Schools
- NCES district ID
- 1804770
- Math proficiency
- 14% ▼ -7.00%
- Reading proficiency
- 20% ▼ -3.00%
- Median HH income
- $32,034
- Composite
- 13.69/100
- National rank
- #9499
- State rank
- #286 of 301 in IN
Livability — Indianapolis city (balance)
No livability data for this city. (Only ~50 U.S. cities are tracked.)
Census & demographics
- Census place
- Indianapolis city (balance), IN
- County
- Marion County · 998,460 people
- City population
- 881,119
- Metro
- Indianapolis-Carmel-Anderson, IN
- Population (ZIP)
- 47,099
- Household income
- $50,325
- Rent vs Own
- Severe rent burden
- 2742.0
Population outlook (Marion County) Hauer SSP2
- Today (2025)
- 1,025,572 people
- By 2030
- 1,065,727 · +3.9%
- By 2040
- 1,141,577 · +11.3%
- By 2050
- 1,208,920 · +17.9%
- By 2075
- 1,367,288 · +33.3%
- By 2100
- 1,438,201 · +40.2%
Race, ethnicity, and origin ACS 2023
- Neighborhood character
- Diverse neighborhood (Simpson 0.62)
- Race & ethnicity
- Black 53% White 25% Hispanic / Latino 17% Two or more races 9% Asian 2%
- Hispanic origin (detail)
- Mexican 11%
- Common ancestry
- Lithuanian 1% Italian 1% Romanian 1%
- Foreign-born
- 11% · Canada
- Languages at home
- 86% English-only · Spanish 10% French/Haitian/Cajun 1% Other Asian/Pacific 1%
Political lean MEDSL · Marion
- 2024 margin
- Strong D (+27.7) · D 63.0% · R 35.3% · Other 1.7%
- 2008→2024 swing
- -0.7pp no change · 2008: 28.4pp · 2024: 27.7pp
- All cycles
- 2024: D+27.7 2020: D+29.1 2016: D+22.8 2012: D+22.2 2008: D+28.4
Not yet ingested
- Civics
- —
Market trends
- HPI YoY
- ▼ -218.85%
- Current HPI
- 239.43
- Rent YoY
- ▲ 6.76%
- Metro
- Indianapolis-Carmel-Anderson, IN
- State GDP YoY
- ▲ 2.90%
- F500 in state
- 18
Industry mix (Fortune 500 HQ in IN)
| Industry | F500 HQs | Revenue |
|---|---|---|
| Industrial Machinery | 2 | $37B |
|
||
| Healthcare | 1 | $177B |
|
||
| Pharmaceuticals | 1 | $45B |
|
||
| Metals / Steel | 1 | $18B |
|
||
| Agriculture | 1 | $17B |
|
||
| Packaging | 1 | $12B |
|
||
Price history
+134.5% since first listed5 events — show timeline
- 2026-05-11 Price Changed $114,900 MIBOR as Distributed by MLS Grid
- 2026-03-31 Listed $124,900 MIBOR as Distributed by MLS Grid
- 2015-04-10 Sold (MLS) $45,000 MIBOR as Distributed by MLS Grid
- 2015-03-27 Contingent — MIBOR as Distributed by MLS Grid
- 2015-03-14 Listed $49,000 MIBOR as Distributed by MLS Grid
Property tax history
+9.2%/yrLatest (2025): $3,305 · -17.5% YoY. Source: county tax records.
Cash-flow waterfall
monthlySold comps — $/sqft
last 12 mo · ≤1 miLoading sold comps…