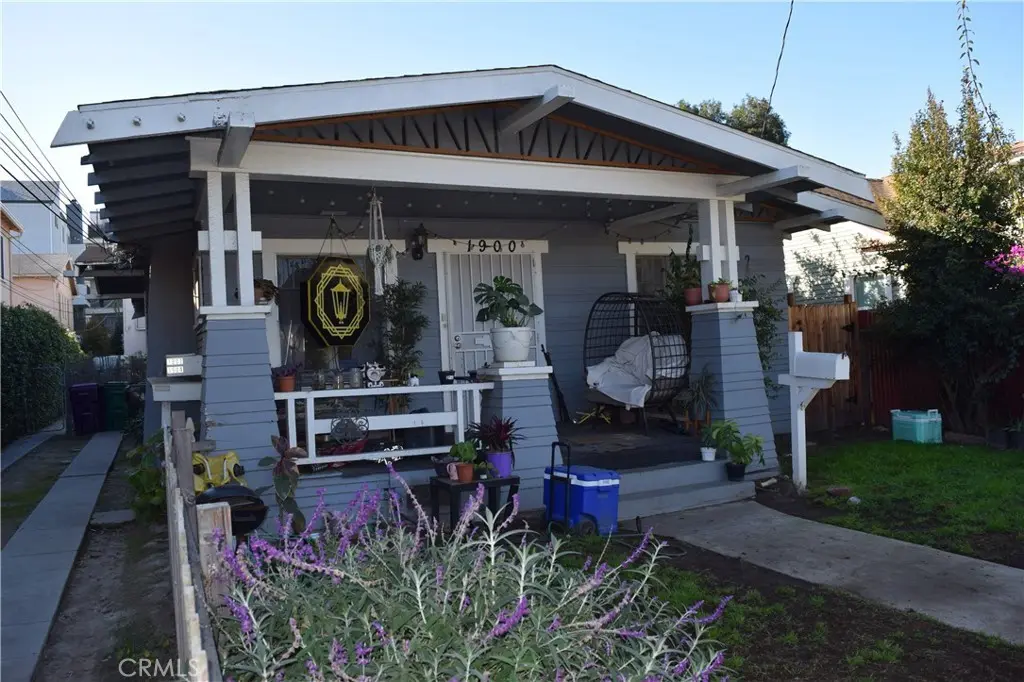
1900 E 6th
Long Beach, CA 90802
$899,000C-
2 bd · 1.0 ba ·
1,066 sqft ·
Built 1911
· MultiFamily
· Active
· 132 DOM
Cashflow @ list (25.0% down · 7.5%)
Estimated rent
$7,858/mo
Mortgage (P&I)
−$4,714
Tax + insurance
−$1,034
HOA
−$0
Vac / Maint / Mgmt
−$1,650
Net cashflow
$459/mo
Annual
$5,507/yr
Cap rate
6.91%
Cash-on-cash
2.19%
DSCR
1.10
1% rule
0.87%
Cash to close
$251,720
Investor read
- This is a 3 × 5-bed/3.0-bath units multifamily listed at $899k.
- At list price, monthly cash flow is $459 ($6k/yr) — positive. Per door: $153/mo.
- The deal already cash-flows at list — no discount required.
- To meet the 1% rule (rent ≥ 1% of price), the offer needs to be $786k (12.6% below list).
- It's been on market 132 days — a 12% lower offer ($791k) is reasonable based on typical stale-listing flexibility.
- Recommended offer: $786k (12.6% below list) — sets the bar for 1% rule.
- Local home prices are declining (-3.0%/yr); year-one equity from $6k of loan paydown is wiped out by about $27k of value loss. Plan a longer hold.
- Location reads 67/100 on livability (#319 in CA) — a middle-class / working-renter tenant base. Strengths: amenities A+, commute A+, employment B+; Watch: health & safety C-, crime F, cost of living F.
- Long Beach Unified (urban): math 34% / reading 50% proficiency, ranked #216 of 517 in CA (top 42%) — families likely to look elsewhere, expect single-tenant / working-renter base with shorter leases.
- Watch-outs: built in 1911 — expect roof / HVAC / electrical / plumbing capex.
- Market conditions: Rents rising (+1.1%/yr); 207 active listings in the ZIP; 40 comparable units currently listed for rent nearby; rentals at typical pace (median 25d on market — plan ~3-4 weeks tenant-placement turnaround); 45% of comp listings sitting > 30 days — soft ceiling on asking rent; 19,697 units permitted in Los Angeles County in 2024 (9,426 in 5+ unit buildings).
- Los Angeles County population projected at +9% by 2050 — modest demand growth; plan on rents tracking national, not racing it.
- Current owner paid $246k; list at $899k implies a 265% gain — meaningful room to come down on a strong offer.
- Cap rate 6.9% vs local median 1.9% in Long Beach — top-decile yield for the area; either an underpriced asset or a hidden risk that comps aren't pricing in. Stress-test before assuming the spread holds.
- At $7,858/mo this rent would consume 127% of the median local household income ($75k/yr) (locally 4689% of renters already pay >50% of income on rent) — very limited rent-growth headroom before tenants either downsize or default.
Questions for listing agent
- It's been on market 132 days. Have you received any prior offers? Is the seller open to a 13% concession, seller financing, or rate buy-down credit?
- Can we see the unit-by-unit rent roll, current vacancy, and any below-market leases? What's the average tenancy length?
- What capital expenditures (roof, boiler, parking lot, exteriors) have been made in the last 5 years, and what's planned in the next 2?
- Built in 1911 — when were the roof, HVAC, electrical panel, plumbing, and water heater last replaced?
- Why hasn't it sold? Are there any deal-killer items the seller is aware of (foundation, flood, title, zoning, code violations)?
- Is there a deadline driving the sale (1031 exchange, divorce, estate, relocation)? That informs how much negotiation room exists.
- Crime grade is F in this area — have there been break-ins, vandalism, or insurance claims at this property in the last 3 years? What carrier currently insures it and at what premium?
- What's the average days-on-market for RENTAL listings here right now (not sales)? A rising rental-DOM trend means longer vacancies and softer asking-rent achievability than the comps imply.
CashFlowRE · CFR-KXA3VQ2NSPT34A
· Data 2 days ago
cashflowre.app · 2026-05-29