 Triplex
1900 E 6th · Long Beach, CA
Flood risk 1/10 · Minimal
- FEMA flood zone
- X (unshaded)
- Chance of flooding over 30 yrs
- 0.0%
- Est. flood insurance / yr
- $507 – $1,088
Fire risk 1/10 · Minimal
- Est. fire insurance / yr
- $659 – $1,223
Heat risk 4/10 · Minor
- Hot days now (above 86°F)
- 7 days/yr
- Hot days in 30 yrs
- 24 days/yr
Wind risk 1/10 · Minimal
- Chance of severe wind over 30 yrs
- —
Air-quality risk 6/10 · Moderate
- Unhealthy air days now
- 9 days/yr
- Unhealthy air days in 30 yrs
- 10 days/yr
Risk factors via First Street. Map © Google.
Why this score? — see what drove the C- grade
The composite is a weighted blend of 9 inputs, each scored 0–100. Each bar is that input's sub-score; the figure is the points it added to the 100-point composite (weight × sub-score).
- Cash flow +16.1/30.0
- ARV discount +14.1/15.0
- DSCR +5.0/10.0
- 1% rule +3.7/10.0
- Schools +3.7/10.0
- Livability +3.4/5.0
- Rent growth +2.8/5.0
- Condition / age +2.5/5.0
- Appreciation +0.0/10.0
$899,000
🖨 Deal sheet 📄 Offer letter ✓ Due diligence
Multi-family units
County records classify this as Multi-Family (2-4 Unit). Listing-text estimate: 3 units. confirmed
Listing remarks MLS
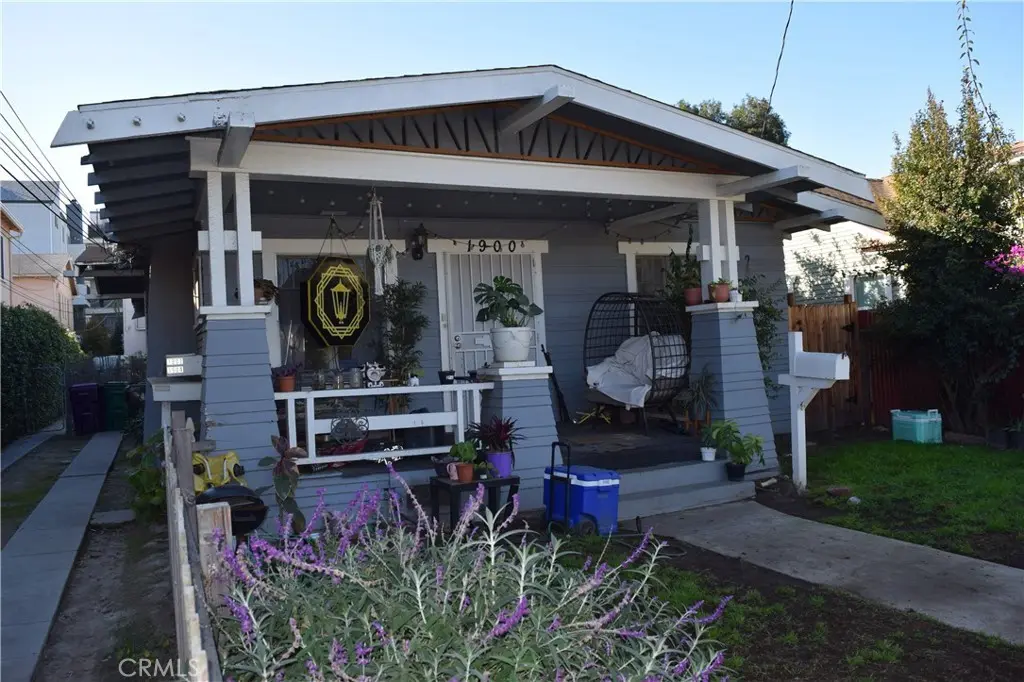
Three unit investment opportunity in Alamitos Beach, just minutes from the beach & Downtown and walking distance to the revitalized 4th Street Corridor. The property offers a unique mix and vintage character. The front unit is a freestanding 2 bedroom/1 bathroom 1911 Craftsman bungalow with a large covered porch, Arts & Crafts beam and rafter details, staggered wood clapboard siding, saw tooth wood eve vents, and decorative pyramidal post details & chimney. The front unit also has a fenced front yard, gated side yard for storage, and a long driveway offering parking for numerous vehicles. The back 2 units are a Spanish style building with ample parking accessed by an alley. The rear lower unit is 2 bedroom/1 bathroom and the upper unit is a 1 bedroom/1 bathroom. The lot is spacious and could offer upside and potential for additional development, ADUs, etc. (buyer to verify with city). The property presents many possibilities, from an pure income investment or an owner occupied front house with two units in the rear to offset costs. Location is well rounded close to the beach, dining, shopping, and entertainment.
Key facts
- Large covered porch
- Fenced front yard
- Alamitos beach
Tags
Neighborhood map
What this means for you Summary
Snapshot
- This is a 3 × 5-bed/3.0-bath units multifamily listed at $899k.
Deal economics
- At list price, monthly cash flow is $459 ($6k/yr) — positive. Per door: $153/mo.
- The deal already cash-flows at list — no discount required.
- To meet the 1% rule (rent ≥ 1% of price), the offer needs to be $786k (12.6% below list).
- Recommended offer: $786k (12.6% below list) — sets the bar for 1% rule.
- Cap rate 6.9% vs local median 1.9% in Long Beach — top-decile yield for the area; either an underpriced asset or a hidden risk that comps aren't pricing in. Stress-test before assuming the spread holds.
Location & tenants
- Location reads 67/100 on livability (#319 in CA) — a middle-class / working-renter tenant base. Strengths: amenities A+, commute A+, employment B+; Watch: health & safety C-, crime F, cost of living F.
- Long Beach Unified (urban): math 34% / reading 50% proficiency, ranked #216 of 517 in CA (top 42%) — families likely to look elsewhere, expect single-tenant / working-renter base with shorter leases.
- Market conditions: Rents rising (+1.1%/yr); 207 active listings in the ZIP; 40 comparable units currently listed for rent nearby; rentals at typical pace (median 25d on market — plan ~3-4 weeks tenant-placement turnaround); 45% of comp listings sitting > 30 days — soft ceiling on asking rent; 19,697 units permitted in Los Angeles County in 2024 (9,426 in 5+ unit buildings).
- At $7,858/mo this rent would consume 127% of the median local household income ($75k/yr) (locally 4689% of renters already pay >50% of income on rent) — very limited rent-growth headroom before tenants either downsize or default.
Forward outlook
- Local home prices are declining (-3.0%/yr); year-one equity from $6k of loan paydown is wiped out by about $27k of value loss. Plan a longer hold.
- Los Angeles County population projected at +9% by 2050 — modest demand growth; plan on rents tracking national, not racing it.
Negotiation context
- It's been on market 132 days — a 12% lower offer ($791k) is reasonable based on typical stale-listing flexibility.
- Current owner paid $246k; list at $899k implies a 265% gain — meaningful room to come down on a strong offer.
Risks & watch-outs
- Watch-outs: built in 1911 — expect roof / HVAC / electrical / plumbing capex.
Questions for the listing agent
- It's been on market 132 days. Have you received any prior offers? Is the seller open to a 13% concession, seller financing, or rate buy-down credit?
- Can we see the unit-by-unit rent roll, current vacancy, and any below-market leases? What's the average tenancy length?
- What capital expenditures (roof, boiler, parking lot, exteriors) have been made in the last 5 years, and what's planned in the next 2?
- Built in 1911 — when were the roof, HVAC, electrical panel, plumbing, and water heater last replaced?
- Why hasn't it sold? Are there any deal-killer items the seller is aware of (foundation, flood, title, zoning, code violations)?
- Is there a deadline driving the sale (1031 exchange, divorce, estate, relocation)? That informs how much negotiation room exists.
- Crime grade is F in this area — have there been break-ins, vandalism, or insurance claims at this property in the last 3 years? What carrier currently insures it and at what premium?
- What's the average days-on-market for RENTAL listings here right now (not sales)? A rising rental-DOM trend means longer vacancies and softer asking-rent achievability than the comps imply.
- What's the recent tenant-quality profile in this submarket — average credit score on applications, eviction rate, late-payment / NSF rate, and stable-employment percentage? A property-management company in the area should have these aggregated.
- How much new apartment / multifamily construction is in the pipeline within 1–3 miles? Heavy new supply (>2% of stock underway) typically softens rents 12–24 months out; light construction supports rent growth.
Investment metrics
- 1% rule
- 0.87% ✗
- Cap rate
- 6.91%
- Cash-on-cash
- 2.19%
- DSCR
- 1.10
- GRM
- 9.5
CMA / ARV
- ARV (median comp)
- $1,053,416
- List price
- $899,000
- Delta
- -14.66%
- Verdict
- UNDERPRICED
- Comps
- 20 within 1.0 mi
Show comp detail 4 sales within ~0.75 mi
| Address | Dist | Beds/Ba | Sqft | Sold | Price | $/sf | Match |
|---|---|---|---|---|---|---|---|
| 2513 E 11th St | 0.61mi | 2/2.0 | 1,122 (+5%) | 12mo | $750,000 | $668 | 49 |
| 727 Martin Luther King Jr Ave | 0.71mi | 2/2.0 | 1,040 (-2%) | 18mo | $599,900 | $577 | 44 |
| 736 N Washington Pl | 0.73mi | 2/2.0 | 1,040 (-2%) | 19mo | $540,000 | $519 | 43 |
| 1184 E 9th St | 0.52mi | 2/2.0 | 1,200 (+13%) | 22mo | $780,000 | $650 | 33 |
Match score weights: distance 35% · size 25% · config 20% · recency 20%. Top-matched comps best support the ARV.
Projected returns pro-forma
-3.0% appreciation · 1.14% rent growth · sell at horizon
- IRR
- -14.8%
- Equity multiple
- 0.48×
- Total profit
- $-131,055
- Equity at exit
- $134,044
- IRR
- -9.4%
- Equity multiple
- 0.47×
- Total profit
- $-134,237
- Equity at exit
- $77,729
Cash invested: $251,720 (down + closing). Projections, not guarantees.
Landlord ↔ Tenant lean methodology
- Overall (STATE)
- 18 Strongly Tenant-Friendly
- State California
- 18 Strongly Tenant-Friendly · D+13
- County
- — inherits STATE
- City
- — inherits STATE
ZIP-level market 90802
- Home prices YoY
- -26.1%
- Rents YoY
- 1.1%
- Active inventory
- 207
- Price-to-rent
- 28.6×
Monthly cashflow live
- Estimated rent
- $7,858 medium interval (Pro) →
- Mortgage (P&I)
- −$4,714
- Tax from tax record
- −$660 /mo · $7,919/yr
- Insurance
- −$375
- HOA
- −$0
- Vacancy / Maint / Mgmt
- −$1,650
- Net cashflow
- $459
Break-even live
3-unit breakdown (identical units grouped — click to expand)
| Units | Beds | Baths | Est. rent |
|---|---|---|---|
| 3× units | 5 | 3 | $7,857 |
| #1 | 5 | 3 | $2,619 |
| #2 | 5 | 3 | $2,619 |
| #3 | 5 | 3 | $2,619 |
| Total (3 units) | $7,858 | ||
UW: 25.0% down · 7.5% · 30yr · 1.5% tax · 5.0% vac · 8.0% maint · 8.0% mgmt
Financing live
Cash to close
- Down payment
- $224,750
- Closing costs
- $26,970
- Reserves months
- —
- Total cash needed
- —
Loan-product check · same deal, 3 products live
Conventional
25% down · 7.5% · 30yr
- Down + closing
- —
- Monthly P&I
- —
- Monthly cashflow
- —
- DSCR
- —
- Eligible?
- —
Personal DTI + credit; lowest rate.
DSCR
20% down · 8.5% · 30yr
- Down + closing
- —
- Monthly P&I
- —
- Monthly cashflow
- —
- DSCR
- —
- Eligible?
- —
No personal income docs; deal must DSCR.
Hard money
10% down · 12.0% · 12mo
- Down + closing
- —
- Monthly P&I
- —
- Monthly cashflow
- —
- DSCR
- —
- Eligible?
- —
Short-term bridge; refi at stabilization.
Rent comps 40 comps
| Address | Beds | Baths | Sqft | Rent | $/sqft | DOM | Units | Dist |
|---|---|---|---|---|---|---|---|---|
| 445 Rose Ave Unit 455-06 Long Beach, CA | 2.0 | 1.0 | 825 | $2,172 | $2.63 | 24d | 1 | 0.12mi |
| 445 Rose Ave Long Beach, CA | 2.0 | 1.0 | 825 | $2,195 | $2.66 | 44d | 1 | 0.12mi |
| 1813 E 7th St Unit 1815 Long Beach, CA | 2.0 | 1.0 | 995 | $1,995 | $2.01 | 24d | 1 | 0.12mi |
| 1637 E 5th St #204 Long Beach, CA | 2.0 | 2.0 | 900 | $2,500 | $2.78 | 44d | 1 | 0.13mi |
| 1636 E 6th St Long Beach, CA | 2.0 | 2.0 | 712 | $2,195 | $3.08 | 13d | 1 | 0.13mi |
| 430 Gaviota Ave Long Beach, CA | 2.0 | 2.0 | 1050 | $2,720 | $2.59 | 44d | 1 | 0.15mi |
| 430 Gaviota Ave Apt 201 Long Beach, CA | 2.0 | 2.0 | 1010 | $2,795 | $2.77 | 44d | 1 | 0.15mi |
| 432 Walnut Ave Unit 442 Long Beach, CA | 1.0 | 1.5 | 800 | $2,245 | $2.81 | 5d | 1 | 0.20mi |
| 787 Gardenia Ave Long Beach, CA | 1.0 | 1.0 | 750 | $1,795 | $2.39 | 44d | 1 | 0.20mi |
| 605 Walnut Ave Unit 10 Long Beach, CA | 2.0 | 1.5 | 900 | $2,400 | $2.67 | 44d | 1 | 0.20mi |
| 1905 E Florida St Long Beach, CA | 2.0 | 1.0 | 863 | $2,495 | $2.89 | 13d | 1 | 0.20mi |
| 623 Walnut Ave Long Beach, CA | 2.0 | 2.0 | 794 | $2,395 | $3.02 | 4d | 1 | 0.20mi |
| 623 Walnut Ave Long Beach, CA | 2.0 | 2.0 | 794 | $2,395 | $3.02 | 24d | 1 | 0.20mi |
| 787 Cherry Ave Unit 4 Long Beach, CA | 2.0 | 2.0 | 740 | $2,094 | $2.83 | 24d | 1 | 0.21mi |
| 755 Gaviota Ave #2 Long Beach, CA | 2.0 | 2.0 | 780 | $2,595 | $3.33 | 24d | 1 | 0.21mi |
| 811 Gardenia Ave Unit 06 Long Beach, CA | 2.0 | 1.0 | 803 | $2,145 | $2.67 | 44d | 1 | 0.24mi |
| 800 Rose Ave Unit 304 Long Beach, CA | 2.0 | 2.0 | 750 | $2,100 | $2.80 | 44d | 1 | 0.24mi |
| 800 Rose Ave Unit 306 Long Beach, CA | 2.0 | 2.0 | 800 | $2,195 | $2.74 | 44d | 1 | 0.24mi |
| 630 Nebraska Ave Unit 03 Long Beach, CA | 2.0 | 1.0 | 860 | $2,495 | $2.90 | 19d | 1 | 0.25mi |
| 2245 E 6th St Unit 202 Long Beach, CA | 2.0 | 2.0 | 1008 | $2,795 | $2.77 | 44d | 1 | 0.25mi |
| 630 Nebraska Ave Unit 06 Long Beach, CA | 2.0 | 1.0 | 1200 | $2,695 | $2.25 | 22d | 1 | 0.25mi |
| 638 Nebraska Ave Long Beach, CA | 2.0 | 1.0 | 1000 | $2,295 | $2.29 | 17d | 1 | 0.26mi |
| 1635 E Erie St Long Beach, CA | 1.0 | 1.0 | 850 | $1,895 | $2.23 | 24d | 1 | 0.27mi |
| 367 Junipero Ave Long Beach, CA | 2.0 | 1.0 | 1200 | $1,200 | $1.00 | 21d | 1 | 0.31mi |
| 1415 E 4th St #7 Long Beach, CA | 2.0 | 1.0 | 864 | $2,350 | $2.72 | 44d | 1 | 0.31mi |
| 910 Gaviota Ave Unit 05 Long Beach, CA | 2.0 | 1.0 | 785 | $2,045 | $2.61 | 44d | 1 | 0.31mi |
| 840 Walnut Ave Long Beach, CA | 2.0 | 1.0 | 890 | $1,775 | $1.99 | 17d | 1 | 0.32mi |
| 1436 E 8th St Unit A Long Beach, CA | 2.0 | 1.0 | 1000 | $2,275 | $2.27 | 24d | 1 | 0.33mi |
| 1810 E 10th St Long Beach, CA | 3.0 | 1.0 | 1372 | $3,750 | $2.73 | 3d | 1 | 0.33mi |
| 2320 E 6th St Unit 2320-02 Long Beach, CA | 2.0 | 1.0 | 800 | $2,395 | $2.99 | 4d | 1 | 0.33mi |
| 1429 E Florida St Apt 203 Long Beach, CA | 2.0 | 2.0 | 725 | $2,395 | $3.30 | 44d | 1 | 0.34mi |
| 1429 E Florida St Unit 303 Long Beach, CA | 2.0 | 2.0 | 725 | $2,495 | $3.44 | 44d | 1 | 0.34mi |
| 2033 E 3rd St Long Beach, CA | 2.0 | 2.0 | 936 | $2,650 | $2.83 | 13d | 1 | 0.35mi |
| 1735 E 10th St Unit A Long Beach, CA | 2.0 | 1.0 | 750 | $2,050 | $2.73 | 44d | 1 | 0.36mi |
| 1350 E 8th St Long Beach, CA | 3.0 | 2.0 | 1200 | $3,700 | $3.08 | 3d | 1 | 0.37mi |
| 1350 E 8th St Long Beach, CA | 2.0 | 1.0 | 1187 | $3,200 | $2.70 | 13d | 1 | 0.37mi |
| 2430 E 7th St Long Beach, CA | 3.0 | 3.0 | 1236 | $3,999 | $3.24 | 44d | 1 | 0.38mi |
| 2420 E 5th St Unit B14 Long Beach, CA | 1.0 | 1.0 | 700 | $2,200 | $3.14 | 11d | 1 | 0.38mi |
| 2075 E 3rd St Unit G Long Beach, CA | 1.0 | 1.0 | 1000 | $2,995 | $3.00 | 44d | 1 | 0.38mi |
| 2075 E 3rd St Apt S Long Beach, CA | 2.0 | 1.5 | 1250 | $4,500 | $3.60 | 44d | 1 | 0.38mi |
Listing history 16 events
-
2026-06-18days on market $899,000 Active 132 DOM
-
2026-06-17days on market $899,000 Active 131 DOM
-
2026-06-16days on market $899,000 Active 130 DOM
-
2026-06-15days on market $899,000 Active 129 DOM
-
2026-06-13days on market $899,000 Active 127 DOM
-
2026-06-13days on market $899,000 Active 126 DOM
-
2026-06-09days on market $899,000 Active 123 DOM
-
2026-06-08days on market $899,000 Active 122 DOM
-
2026-06-07days on market $899,000 Active 121 DOM
-
2026-06-04days on market $899,000 Active 118 DOM
-
2026-06-03days on market $899,000 Active 117 DOM
-
2026-06-02days on market $899,000 Active 116 DOM
-
2026-06-01days on market $899,000 Active 115 DOM
-
2026-05-31days on market $899,000 Active 114 DOM
-
2026-02-06$899,000 Active 1147-char remark
Show marketing remark (1147 chars)
Three unit investment opportunity in Alamitos Beach, just minutes from the beach & Downtown and walking distance to the revitalized 4th Street Corridor. The property offers a unique mix and vintage character. The front unit is a freestanding 2 bedroom/1 bathroom 1911 Craftsman bungalow with a large covered porch, Arts & Crafts beam and rafter details, staggered wood clapboard siding, saw tooth wood eve vents, and decorative pyramidal post details & chimney. The front unit also has a fenced front yard, gated side yard for storage, and a long driveway offering parking for numerous vehicles. The back 2 units are a Spanish style building with ample parking accessed by an alley. The rear lower unit is 2 bedroom/1 bathroom and the upper unit is a 1 bedroom/1 bathroom. The lot is spacious and could offer upside and potential for additional development, ADUs, etc. (buyer to verify with city). The property presents many possibilities, from an pure income investment or an owner occupied front house with two units in the rear to offset costs. Location is well rounded close to the beach, dining, shopping, and entertainment.
-
1989-04-26soldstatus $246,000
ⓘ Source: listings_history table (triggers on properties + properties_extension) + one-shot
backfill from property_details.listing_events for pre-trigger history.
Tax reassessment forecast CA · Resets to sale price
- Current annual tax
- $7,919 · $660/mo
- Projected year-2 tax
- $7,919 · $660/mo
- Expected delta
- $0/yr ($0/mo · 0.0%)
ⓘ Screening estimate from a state-policy table — verify with the county assessor before closing.
Climate risk First Street
- Flood 1/10 Low FEMA zone X (unshaded) · 0% chance over 30 yrs
- Wildfire 1/10 Low
- Heat 4/10 Moderate 7 d/yr ≥86°F today · 24 d/yr by 30 yrs out
- Wind 1/10 Low
- Air quality 6/10 Major 9 unhealthy d/yr today · 10 by 30 yrs out
Nearby sold comps map
Loading sold comps map…
Walkable amenities ~0.75 mi
Loading nearby amenities…
Taxation est. · year 1
- Rental income
- $94,296
- − Mortgage interest
- −$50,358
- − Property taxes
- −$7,919
- − Insurance
- −$4,495
- − Repairs & maintenance
- −$7,544
- − Management
- −$7,544
- − Depreciation
- −$26,153
- Taxable loss
- −$9,716
- Est. tax savings @ 24.0%
- +$2,332
- After-tax cash flow
- $7,839/yr
For passive investors: Depreciation is non-cash, so a rental often shows a tax loss while cash-flowing — sheltering income. Rental losses are passive: they offset passive income freely, and up to $25,000/yr can offset ordinary (W-2) income if you actively participate and your MAGI is under $100k (phasing out to $0 by $150k); unused losses carry forward. On sale, claimed depreciation is recaptured at up to 25%, and gains may owe capital-gains tax (a 1031 exchange can defer both). Figures are a year-1 estimate at your 24.0% rate — not tax advice; consult a CPA.
Schools (NCES district)
- District
- Long Beach Unified
- NCES district ID
- 0622500
- Math proficiency
- 34% ▼ -11.00%
- Reading proficiency
- 50% ▼ -4.00%
- Median HH income
- $56,092
- Composite
- 36.67/100
- National rank
- #4607
- State rank
- #216 of 517 in CA
Livability — Long Beach
- Score
- 67/100
- State rank
- #319
- US rank
- #10758
Category grades
Schools grade is shown separately in the Schools card above.
Census & demographics
- Census place
- Long Beach, CA
- County
- Los Angeles County · 9,444,647 people
- City population
- 466,088
- Metro
- Los Angeles-Long Beach-Anaheim, CA
- Population (ZIP)
- 40,434
- Household income
- $74,510
- Rent vs Own
- Severe rent burden
- 4689.0
Population outlook (Los Angeles County) Hauer SSP2
- Today (2025)
- 10,940,515 people
- By 2030
- 11,256,481 · +2.9%
- By 2040
- 11,729,929 · +7.2%
- By 2050
- 11,948,407 · +9.2%
- By 2075
- 11,818,114 · +8.0%
- By 2100
- 10,842,928 · -0.9%
Race, ethnicity, and origin ACS 2023
- Neighborhood character
- Highly diverse neighborhood (Simpson 0.72)
- Race & ethnicity
- Hispanic / Latino 37% White 32% Black 15% Two or more races 14% Asian 8% Native American 1%
- Hispanic origin (detail)
- Mexican 27% Puerto Rican 1%
- Common ancestry
- Romanian 2% Lithuanian 2% Estonian 2%
- Foreign-born
- 20% · Canada, China, South Korea
- Languages at home
- 64% English-only · Spanish 27% Other Indo-European 3% Tagalog/Filipino 2%
Political lean MEDSL · Los Angeles
- 2024 margin
- Solid D (+32.9) · D 64.8% · R 31.9% · Other 3.3%
- 2008→2024 swing
- -7.4pp toward R · 2008: 40.4pp · 2024: 32.9pp
- All cycles
- 2024: D+32.9 2020: D+44.2 2016: D+48.0 2012: D+40.0 2008: D+40.4
Not yet ingested
- Civics
- —
Market trends
- HPI YoY
- ▼ -134.40%
- Current HPI
- 380.7305
- Rent YoY
- ▲ 1.14%
- Metro
- Los Angeles-Long Beach-Anaheim, CA
- State GDP YoY
- ▲ 3.21%
- F500 in state
- 116
Industry mix (Fortune 500 HQ in CA)
| Industry | F500 HQs | Revenue |
|---|---|---|
| Technology | 27 | $1,492B |
|
||
| Financial Services | 3 | $174B |
|
||
| Retail | 3 | $44B |
|
||
| Insurance | 3 | $26B |
|
||
| Media / Entertainment | 2 | $115B |
|
||
| Pharmaceuticals / Biotech | 2 | $62B |
|
||
Price history
+265.4% since first listed2 events — show timeline
- 2026-02-06 Listed $899,000 CRMLS
- 1989-04-26 Sold (Public Records) $246,000 Public Records
Property tax history
+4.0%/yrLatest (2025): $7,919 · +4.2% YoY. Source: county tax records.
Cash-flow waterfall
monthlySold comps — $/sqft
last 12 mo · ≤1 miLoading sold comps…