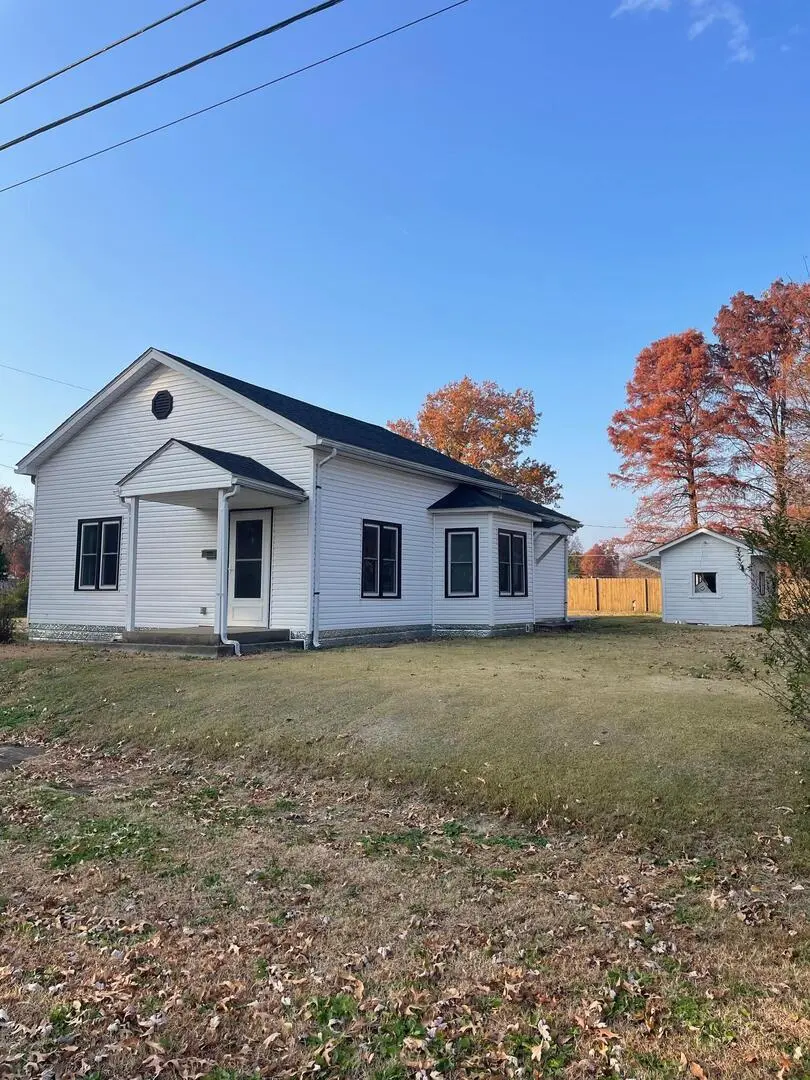
316 Nevada St
Carterville, IL 62918
$74,900C+
1 bd · 1.0 ba ·
1,050 sqft ·
Built 1900
· Other
· Active
· 137 DOM
Cashflow @ list (25.0% down · 7.5%)
Estimated rent
$949/mo
Mortgage (P&I)
−$393
Tax + insurance
−$229
HOA
−$0
Vac / Maint / Mgmt
−$199
Net cashflow
$127/mo
Annual
$1,529/yr
Cap rate
8.33%
Cash-on-cash
7.29%
DSCR
1.32
1% rule
1.27%
Cash to close
$20,972
Investor read
- This is a 1-bed/1.0-bath other listed at $75k.
- At list price, monthly cash flow is $127 ($2k/yr) — positive.
- The deal already cash-flows at list — no discount required.
- Meets the 1% rule at list price ($949 rent vs $75k).
- It's been on market 137 days — a 12% lower offer ($66k) is reasonable based on typical stale-listing flexibility.
- Recommended offer: $66k (12.0% below list) — sets the bar for market timing.
- Local home prices are declining (-3.0%/yr); year-one equity from $518 of loan paydown is wiped out by about $2k of value loss. Plan a longer hold.
- Location reads 75/100 on livability (#211 in IL, #3,939 nationally) — a middle-class / working-renter tenant base. Strengths: cost of living A+, housing A+, health & safety A+; Watch: amenities F, commute F.
- Carterville CUSD 5 (suburban): math 29% / reading 43% proficiency, ranked #185 of 620 in IL (top 30%) — families likely to look elsewhere, expect single-tenant / working-renter base with shorter leases.
- Watch-outs: property tax is 3.2% of price; built in 1900 — expect roof / HVAC / electrical / plumbing capex.
- Market conditions: 110 active listings in the ZIP; 130 units permitted in Williamson County in 2024 (5 in 5+ unit buildings).
- 2 sale attempts since 3y ago; this cycle's ask has dropped $8k (9%) from the opening price — seller is motivated, your offer sets the floor, not the list.
- Climate carrying-cost: extreme-heat days projected 7→20/yr by 2055 (HVAC capex compounding) — expect insurance premiums to compound above CPI over the hold.
- Cap rate 8.3% vs local median 4.7% in Carterville — top-decile yield for the area; either an underpriced asset or a hidden risk that comps aren't pricing in. Stress-test before assuming the spread holds.
- This rent is only 16% of the median local income ($71k/yr) — well below the 30% rent-burden line; pricing power to push rent on renewal without tenant pushback.
Questions for listing agent
- It's been on market 137 days. Have you received any prior offers? Is the seller open to a 12% concession, seller financing, or rate buy-down credit?
- Built in 1900 — when were the roof, HVAC, electrical panel, plumbing, and water heater last replaced?
- Property tax is high relative to price — has the assessment been appealed recently, and will the sale trigger a re-assessment?
- Why hasn't it sold? Are there any deal-killer items the seller is aware of (foundation, flood, title, zoning, code violations)?
- Is there a deadline driving the sale (1031 exchange, divorce, estate, relocation)? That informs how much negotiation room exists.
- What's the average days-on-market for RENTAL listings here right now (not sales)? A rising rental-DOM trend means longer vacancies and softer asking-rent achievability than the comps imply.
- What's the recent tenant-quality profile in this submarket — average credit score on applications, eviction rate, late-payment / NSF rate, and stable-employment percentage? A property-management company in the area should have these aggregated.
- How much new for-sale + rental construction is in the pipeline within 1–3 miles? Heavy new supply typically softens prices + rents 12–24 months out; constrained supply supports both.
CashFlowRE · CFR-KYGP308VXFTRTY
· Data 1 day ago
cashflowre.app · 2026-05-29