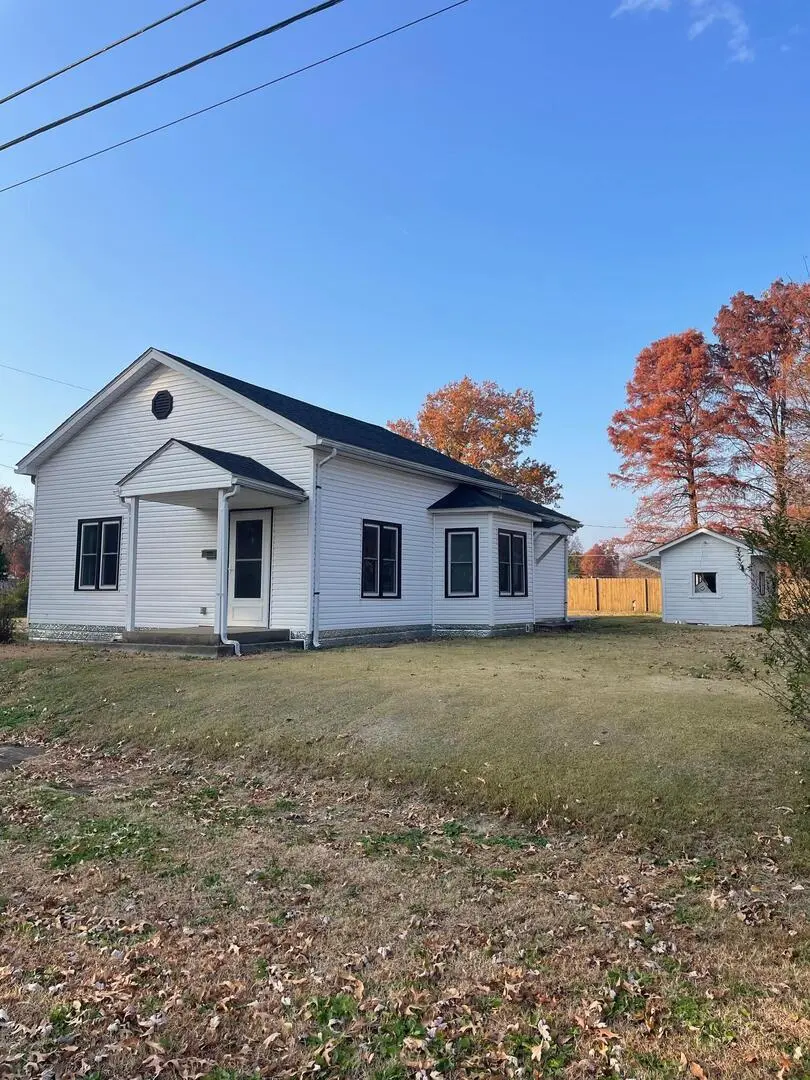
316 Nevada St · Carterville, IL
Flood risk 1/10 · Minimal
- FEMA flood zone
- X (unshaded)
- Chance of flooding over 30 yrs
- 0.0%
- Est. flood insurance / yr
- $507 – $1,088
Fire risk 1/10 · Minimal
- Est. fire insurance / yr
- $804 – $1,492
Heat risk 5/10 · Moderate
- Hot days now (above 107°F)
- 7 days/yr
- Hot days in 30 yrs
- 20 days/yr
Wind risk 2/10 · Minimal
- Chance of severe wind over 30 yrs
- 3.0%
Air-quality risk 2/10 · Minimal
- Unhealthy air days now
- 0 days/yr
- Unhealthy air days in 30 yrs
- 1 days/yr
Risk factors via First Street. Map © Google.
Why this score? — see what drove the C+ grade
The composite is a weighted blend of 9 inputs, each scored 0–100. Each bar is that input's sub-score; the figure is the points it added to the 100-point composite (weight × sub-score).
- Cash flow +22.6/30.0
- ARV discount +15.0/15.0
- 1% rule +7.7/10.0
- DSCR +7.2/10.0
- Livability +3.8/5.0
- Schools +3.1/10.0
- Rent growth +2.5/5.0
- Condition / age +2.5/5.0
- Appreciation +0.0/10.0
$74,900
🖨 Deal sheet 📄 Offer letter ✓ Due diligence
Listing remarks MLS
Welcome to this charming 1 bedroom home located at 316 Nevada St in Carterville, IL on a nice corner lot. Recently remodeled, in the last 2 years, new roof, new HVAC heat pump system, new windows, new doors, new pex plumbing, new hot water heater, new LVP flooring, new toilet, new vanity, all fresh paint, new breaker panel all wiring inspected and updated as needed, new outside meter, all outlets, switches, lights replaced, new siding, new kitchen sink and faucet.....move in ready!!
Key facts
- New pex plumbing
- New doors
- Corner lot
Tags
Neighborhood map
What this means for you Summary
Snapshot
- This is a 1-bed/1.0-bath other listed at $75k.
Deal economics
- At list price, monthly cash flow is $127 ($2k/yr) — positive.
- The deal already cash-flows at list — no discount required.
- Meets the 1% rule at list price ($949 rent vs $75k).
- Recommended offer: $66k (12.0% below list) — sets the bar for market timing.
- Cap rate 8.3% vs local median 4.7% in Carterville — top-decile yield for the area; either an underpriced asset or a hidden risk that comps aren't pricing in. Stress-test before assuming the spread holds.
Location & tenants
- Location reads 75/100 on livability (#211 in IL, #3,939 nationally) — a middle-class / working-renter tenant base. Strengths: cost of living A+, housing A+, health & safety A+; Watch: amenities F, commute F.
- Carterville CUSD 5 (suburban): math 29% / reading 43% proficiency, ranked #185 of 620 in IL (top 30%) — families likely to look elsewhere, expect single-tenant / working-renter base with shorter leases.
- Market conditions: 110 active listings in the ZIP; 130 units permitted in Williamson County in 2024 (5 in 5+ unit buildings).
- This rent is only 16% of the median local income ($71k/yr) — well below the 30% rent-burden line; pricing power to push rent on renewal without tenant pushback.
Forward outlook
- Local home prices are declining (-3.0%/yr); year-one equity from $518 of loan paydown is wiped out by about $2k of value loss. Plan a longer hold.
Negotiation context
- It's been on market 137 days — a 12% lower offer ($66k) is reasonable based on typical stale-listing flexibility.
- 2 sale attempts since 3y ago; this cycle's ask has dropped $8k (9%) from the opening price — seller is motivated, your offer sets the floor, not the list.
Risks & watch-outs
- Watch-outs: property tax is 3.2% of price; built in 1900 — expect roof / HVAC / electrical / plumbing capex.
- Climate carrying-cost: extreme-heat days projected 7→20/yr by 2055 (HVAC capex compounding) — expect insurance premiums to compound above CPI over the hold.
Questions for the listing agent
- It's been on market 137 days. Have you received any prior offers? Is the seller open to a 12% concession, seller financing, or rate buy-down credit?
- Built in 1900 — when were the roof, HVAC, electrical panel, plumbing, and water heater last replaced?
- Property tax is high relative to price — has the assessment been appealed recently, and will the sale trigger a re-assessment?
- Why hasn't it sold? Are there any deal-killer items the seller is aware of (foundation, flood, title, zoning, code violations)?
- Is there a deadline driving the sale (1031 exchange, divorce, estate, relocation)? That informs how much negotiation room exists.
- What's the average days-on-market for RENTAL listings here right now (not sales)? A rising rental-DOM trend means longer vacancies and softer asking-rent achievability than the comps imply.
- What's the recent tenant-quality profile in this submarket — average credit score on applications, eviction rate, late-payment / NSF rate, and stable-employment percentage? A property-management company in the area should have these aggregated.
- How much new for-sale + rental construction is in the pipeline within 1–3 miles? Heavy new supply typically softens prices + rents 12–24 months out; constrained supply supports both.
Investment metrics
- 1% rule
- 1.27% ✓
- Cap rate
- 8.33%
- Cash-on-cash
- 7.29%
- DSCR
- 1.32
- GRM
- 6.6
CMA / ARV
- ARV (median comp)
- $99,999
- List price
- $74,900
- Delta
- -25.10%
- Verdict
- UNDERPRICED
- Comps
- 20 within 1.0 mi
Projected returns pro-forma
-3.0% appreciation · 3.0% rent growth · sell at horizon
- IRR
- -5.0%
- Equity multiple
- 0.81×
- Total profit
- $-3,943
- Equity at exit
- $11,168
- IRR
- 4.7%
- Equity multiple
- 1.35×
- Total profit
- $7,335
- Equity at exit
- $6,476
Cash invested: $20,972 (down + closing). Projections, not guarantees.
Landlord ↔ Tenant lean methodology
- Overall (STATE)
- 43 Moderately Tenant-Leaning
- State Illinois
- 43 Moderately Tenant-Leaning · D+7
- County
- — inherits STATE
- City
- — inherits STATE
ZIP-level market 62918
- Home prices YoY
- -13.8%
- Active inventory
- 110
- Price-to-rent
- 6.6×
Monthly cashflow live
- Estimated rent
- $949 medium interval (Pro) →
- Mortgage (P&I)
- −$393
- Tax from tax record
- −$198 /mo · $2,378/yr
- Insurance
- −$31
- HOA
- −$0
- Vacancy / Maint / Mgmt
- −$199
- Net cashflow
- $127
Break-even live
UW: 25.0% down · 7.5% · 30yr · 1.5% tax · 5.0% vac · 8.0% maint · 8.0% mgmt
Financing live
Cash to close
- Down payment
- $18,725
- Closing costs
- $2,247
- Reserves months
- —
- Total cash needed
- —
Loan-product check · same deal, 3 products live
Conventional
25% down · 7.5% · 30yr
- Down + closing
- —
- Monthly P&I
- —
- Monthly cashflow
- —
- DSCR
- —
- Eligible?
- —
Personal DTI + credit; lowest rate.
DSCR
20% down · 8.5% · 30yr
- Down + closing
- —
- Monthly P&I
- —
- Monthly cashflow
- —
- DSCR
- —
- Eligible?
- —
No personal income docs; deal must DSCR.
Hard money
10% down · 12.0% · 12mo
- Down + closing
- —
- Monthly P&I
- —
- Monthly cashflow
- —
- DSCR
- —
- Eligible?
- —
Short-term bridge; refi at stabilization.
Listing history 21 events
-
2026-06-19days on market $74,900 Active 137 DOM
-
2026-06-18days on market $74,900 Active 136 DOM
-
2026-06-17days on market $74,900 Active 135 DOM
-
2026-06-16days on market $74,900 Active 134 DOM
-
2026-06-15days on market $74,900 Active 133 DOM
-
2026-06-14days on market $74,900 Active 131 DOM
-
2026-06-13days on market $74,900 Active 130 DOM
-
2026-06-10days on market $74,900 Active 128 DOM
-
2026-06-09days on market $74,900 Active 127 DOM
-
2026-06-08days on market $74,900 Active 126 DOM
-
2026-06-07days on market $74,900 Active 125 DOM
-
2026-06-05days on market $74,900 Active 122 DOM
-
2026-06-02days on market $74,900 Active 120 DOM
-
2026-06-01days on market $74,900 Active 119 DOM
-
2026-05-31days on market $74,900 Active 118 DOM
-
2026-05-30days on market $74,900 Active 117 DOM
-
2026-03-19price $75,000 487-char remark
Show marketing remark (487 chars)
Welcome to this charming 1 bedroom home located at 316 Nevada St in Carterville, IL on a nice corner lot. Recently remodeled, in the last 2 years, new roof, new HVAC heat pump system, new windows, new doors, new pex plumbing, new hot water heater, new LVP flooring, new toilet, new vanity, all fresh paint, new breaker panel all wiring inspected and updated as needed, new outside meter, all outlets, switches, lights replaced, new siding, new kitchen sink and faucet.....move in ready!!
-
2026-02-01$82,500 Active 487-char remark
Show marketing remark (487 chars)
Welcome to this charming 1 bedroom home located at 316 Nevada St in Carterville, IL on a nice corner lot. Recently remodeled, in the last 2 years, new roof, new HVAC heat pump system, new windows, new doors, new pex plumbing, new hot water heater, new LVP flooring, new toilet, new vanity, all fresh paint, new breaker panel all wiring inspected and updated as needed, new outside meter, all outlets, switches, lights replaced, new siding, new kitchen sink and faucet.....move in ready!!
-
2023-05-11soldstatus Closed 87-char remark
Show marketing remark (87 chars)
Bungalow in Carterville Illinois, great rehab project. Large city lot with outbuilding.
-
2023-04-18status Pending 87-char remark
Show marketing remark (87 chars)
Bungalow in Carterville Illinois, great rehab project. Large city lot with outbuilding.
-
2023-03-09$19,900 Active 87-char remark
Show marketing remark (87 chars)
Bungalow in Carterville Illinois, great rehab project. Large city lot with outbuilding.
ⓘ Source: listings_history table (triggers on properties + properties_extension) + one-shot
backfill from property_details.listing_events for pre-trigger history.
Tax reassessment forecast IL · Partial reset (capped growth)
- Current annual tax
- $2,378 · $198/mo
- Projected year-2 tax
- $2,378 · $198/mo
- Expected delta
- $0/yr ($0/mo · 0.0%)
ⓘ Screening estimate from a state-policy table — verify with the county assessor before closing.
Climate risk First Street
- Flood 1/10 Low FEMA zone X (unshaded) · 0% chance over 30 yrs
- Wildfire 1/10 Low
- Heat 5/10 Major 7 d/yr ≥107°F today · 20 d/yr by 30 yrs out
- Wind 2/10 Low 3% chance of damaging wind over 30 yrs
- Air quality 2/10 Low 0 unhealthy d/yr today · 1 by 30 yrs out
Nearby sold comps map
Loading sold comps map…
Walkable amenities ~0.75 mi
Loading nearby amenities…
Taxation est. · year 1
- Rental income
- $11,386
- − Mortgage interest
- −$4,196
- − Property taxes
- −$2,378
- − Insurance
- −$374
- − Repairs & maintenance
- −$911
- − Management
- −$911
- − Depreciation
- −$2,179
- Taxable income
- $437
- Est. tax owed @ 24.0%
- −$105
- After-tax cash flow
- $1,424/yr
For passive investors: Depreciation is non-cash, so a rental often shows a tax loss while cash-flowing — sheltering income. Rental losses are passive: they offset passive income freely, and up to $25,000/yr can offset ordinary (W-2) income if you actively participate and your MAGI is under $100k (phasing out to $0 by $150k); unused losses carry forward. On sale, claimed depreciation is recaptured at up to 25%, and gains may owe capital-gains tax (a 1031 exchange can defer both). Figures are a year-1 estimate at your 24.0% rate — not tax advice; consult a CPA.
Schools (NCES district)
- District
- Carterville CUSD 5
- NCES district ID
- 1708640
- Math proficiency
- 29% ▼ -16.00%
- Reading proficiency
- 43% ▼ -18.00%
- Median HH income
- $47,344
- Composite
- 30.87/100
- National rank
- #6122
- State rank
- #185 of 620 in IL
Livability — Carterville
- Score
- 75/100
- State rank
- #211
- US rank
- #3939
Category grades
Schools grade is shown separately in the Schools card above.
Census & demographics
- Census place
- Carterville, IL
- County
- Williamson County · 38,451 people
- City population
- 10,658
- Metro
- Carbondale-Marion, IL
- Population (ZIP)
- 10,658
- Household income
- $70,920
- Rent vs Own
- Severe rent burden
- 240.0
Population outlook (Williamson County) Hauer SSP2
- Today (2025)
- 69,553 people
- By 2030
- 70,090 · +0.8%
- By 2040
- 70,345 · +1.1%
- By 2050
- 69,394 · -0.2%
- By 2075
- 63,590 · -8.6%
- By 2100
- 51,154 · -26.5%
Race, ethnicity, and origin ACS 2023
- Neighborhood character
- Predominantly White (89%)
- Race & ethnicity
- White 89% Two or more races 4% Hispanic / Latino 3% Asian 3% Black 2%
- Common ancestry
- Slovak 4% Italian 2% Lithuanian 2%
- Foreign-born
- 2% · Canada, Vietnam
- Languages at home
- 96% English-only · Spanish 2% Other Indo-European 1% Vietnamese 1%
Political lean MEDSL · Williamson
- 2024 margin
- Solid R (+38.8) · D 30.0% · R 68.8% · Other 1.3%
- 2008→2024 swing
- -24.0pp toward R · 2008: -14.8pp · 2024: -38.8pp
- All cycles
- 2024: R+38.8 2020: R+37.3 2016: R+41.2 2012: R+25.0 2008: R+14.8
Not yet ingested
- Civics
- —
Market trends
- HPI YoY
- ▼ -25.58%
- Current HPI
- 159.1431
- Rent YoY
- —
- Metro
- Carbondale-Marion, IL
- State GDP YoY
- ▲ 1.59%
- F500 in state
- 60
Industry mix (Fortune 500 HQ in IL)
| Industry | F500 HQs | Revenue |
|---|---|---|
| Insurance | 4 | $201B |
|
||
| Consumer Goods | 4 | $87B |
|
||
| Industrial Machinery | 3 | $64B |
|
||
| Healthcare | 2 | $55B |
|
||
| Retail / Pharmacy | 1 | $148B |
|
||
| Agriculture / Food | 1 | $86B |
|
||
Price history
+276.9% since first listed5 events — show timeline
- 2026-03-19 Price Changed $75,000 MRED as Distributed by MLS Grid
- 2026-02-01 Listed $82,500 MRED as Distributed by MLS Grid
- 2023-05-11 Sold (MLS) — MARIS as Distributed by MLS Grid
- 2023-04-18 Pending — MARIS as Distributed by MLS Grid
- 2023-03-09 Listed $19,900 MARIS as Distributed by MLS Grid
Property tax history
+25.6%/yrLatest (2025): $2,378 · +198.2% YoY. Source: county tax records.
Cash-flow waterfall
monthlySold comps — $/sqft
last 12 mo · ≤1 miLoading sold comps…