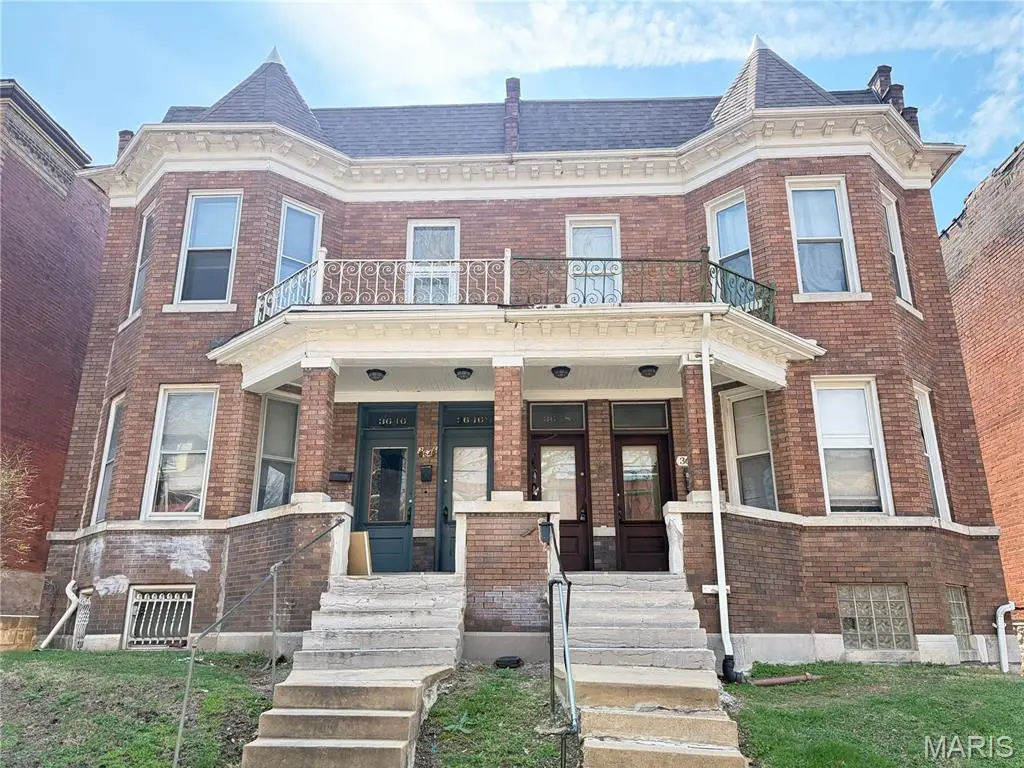
3648 Shenandoah Ave
St. Louis, MO 63110
$499,000C
None bd · 6.0 ba ·
2,802 sqft ·
Built 1906
· MultiFamily
· Active
· 78 DOM
Cashflow @ list (25.0% down · 7.5%)
Estimated rent
$6,562/mo
Mortgage (P&I)
−$2,617
Tax + insurance
−$550
HOA
−$0
Vac / Maint / Mgmt
−$1,378
Net cashflow
$2,017/mo
Annual
$24,208/yr
Cap rate
11.14%
Cash-on-cash
17.33%
DSCR
1.77
1% rule
1.32%
Cash to close
$139,720
Investor read
- This is a ?-bed/6.0-bath multifamily listed at $499k.
- At list price, monthly cash flow is $2k ($24k/yr) — positive.
- The deal already cash-flows at list — no discount required.
- Meets the 1% rule at list price ($7k rent vs $499k).
- It's been on market 78 days — a 6% lower offer ($469k) is reasonable based on typical stale-listing flexibility.
- Recommended offer: $469k (6.0% below list) — sets the bar for market timing.
- Local home prices are declining (-3.0%/yr); year-one equity from $3k of loan paydown is wiped out by about $15k of value loss. Plan a longer hold.
- Location reads: area grade C — affects rentability + tenant quality, not the cash-flow math above.
- St. Louis City (urban): math 10% / reading 18% proficiency, ranked #312 of 324 in MO (top 96%) — low school quality limits family demand, transient renter base, plan for 1-2y turnover; 80% free/reduced lunch — lower-income household profile, screen leases tightly.
- Watch-outs: built in 1906 — expect roof / HVAC / electrical / plumbing capex.
- Market conditions: Rents rising fast (+6.2%/yr); 98 active listings in the ZIP; 9 comparable units currently listed for rent nearby; rentals at typical pace (median 15d on market — plan ~3-4 weeks tenant-placement turnaround); solid renter incomes; 294 units permitted in St. Louis city in 2024 (227 in 5+ unit buildings).
- St. Louis County population projected to shrink 6% by 2050 — rents likely to lag national; underwrite the cash flow, not the appreciation.
- Current owner paid $180k; list at $499k implies a 177% gain — meaningful room to come down on a strong offer.
- At projected returns (-3.0% appreciation + 6.2% rent growth), your $140k cash investment doubles in ~6 years — after that, you're playing with house money.
- Climate carrying-cost: extreme-heat days projected 7→20/yr by 2055 (HVAC capex compounding) — expect insurance premiums to compound above CPI over the hold.
- Cap rate 11.1% vs local median 5.0% in St. Louis — top-decile yield for the area; either an underpriced asset or a hidden risk that comps aren't pricing in. Stress-test before assuming the spread holds.
- At $6,562/mo this rent would consume 96% of the median local household income ($82k/yr) (locally 921% of renters already pay >50% of income on rent) — very limited rent-growth headroom before tenants either downsize or default.
Questions for listing agent
- It's been on market 78 days. Have you received any prior offers? Is the seller open to a 6% concession, seller financing, or rate buy-down credit?
- Built in 1906 — when were the roof, HVAC, electrical panel, plumbing, and water heater last replaced?
- Why hasn't it sold? Are there any deal-killer items the seller is aware of (foundation, flood, title, zoning, code violations)?
- Is there a deadline driving the sale (1031 exchange, divorce, estate, relocation)? That informs how much negotiation room exists.
- What's the average days-on-market for RENTAL listings here right now (not sales)? A rising rental-DOM trend means longer vacancies and softer asking-rent achievability than the comps imply.
- What's the recent tenant-quality profile in this submarket — average credit score on applications, eviction rate, late-payment / NSF rate, and stable-employment percentage? A property-management company in the area should have these aggregated.
- How much new apartment / multifamily construction is in the pipeline within 1–3 miles? Heavy new supply (>2% of stock underway) typically softens rents 12–24 months out; light construction supports rent growth.
CashFlowRE · CFR-KYK6H8DGPKDN8T
· Data 2 days ago
cashflowre.app · 2026-05-29