 Multi-family
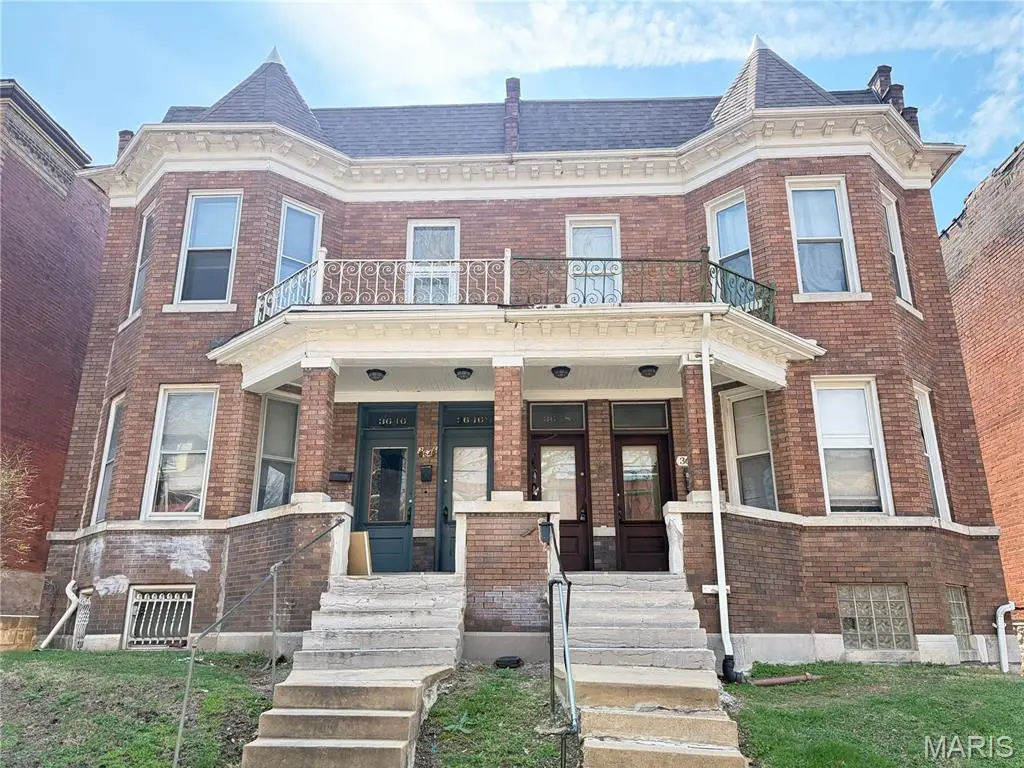
3648 Shenandoah Ave · St. Louis, MO
Flood risk 1/10 · Minimal
- FEMA flood zone
- X (unshaded)
- Chance of flooding over 30 yrs
- 0.0%
- Est. flood insurance / yr
- $473 – $860
Fire risk 1/10 · Minimal
- Est. fire insurance / yr
- $1,054 – $1,958
Heat risk 5/10 · Moderate
- Hot days now (above 108°F)
- 7 days/yr
- Hot days in 30 yrs
- 20 days/yr
Wind risk 2/10 · Minimal
- Chance of severe wind over 30 yrs
- 1.0%
Air-quality risk 3/10 · Minor
- Unhealthy air days now
- 3 days/yr
- Unhealthy air days in 30 yrs
- 4 days/yr
Risk factors via First Street. Map © Google.
Why this score? — see what drove the C grade
The composite is a weighted blend of 9 inputs, each scored 0–100. Each bar is that input's sub-score; the figure is the points it added to the 100-point composite (weight × sub-score).
- Cash flow +30.0/30.0
- DSCR +10.0/10.0
- 1% rule +8.2/10.0
- Rent growth +4.1/5.0
- Livability +2.5/5.0
- Condition / age +2.5/5.0
- Schools +1.2/10.0
- ARV discount +0.0/15.0
- Appreciation +0.0/10.0
$499,000
🖨 Deal sheet 📄 Offer letter ✓ Due diligence
Multi-family units
County records classify this as Multi-Family (5+ Unit). Listing-text estimate: 1 unit. estimate disagrees with records
5+ unit building — per-unit beds/baths from public records are typically unavailable; the breakdown below (if shown) is an estimate from the listing text.
Listing remarks MLS
Investor Alert! Welcome to this fully rented, gorgeous multifamily building just blocks from Tower Grove Park! Step inside to a clean and updated first and second floor common hallway. This sale is composed of only the west half of this building and has 6 efficient units that have high potential for rent increases and improvements. 3 units on the second floor, and 3 units on the first floor. Perfect for SLU students, Barnes Jewish/Cardinal Glennon employees or any of other prospects vying to live in Shaw at an affordable price. Several updates throughout the building and in a couple units (see supplements). Both floors have direct access to the fully, unfinished basement. There is no laundry and could be added for some easy extra income. Several tenants are going on their second year here. Whether you want to keep it for long-term cash flow, renovate and resale, or explore short term rentals, this property offers many exit strategies. Owner currently pays all utilities for tenants with no RUBS (again, an easy opportunity for more cash flow). Please do not disturb tenants.
Key facts
- Several updates
- Efficient units
- Multifamily building
Tags
Neighborhood map
What this means for you Summary
Snapshot
- This is a ?-bed/6.0-bath multifamily listed at $499k.
Deal economics
- At list price, monthly cash flow is $2k ($24k/yr) — positive.
- The deal already cash-flows at list — no discount required.
- Meets the 1% rule at list price ($7k rent vs $499k).
- Recommended offer: $469k (6.0% below list) — sets the bar for market timing.
- Cap rate 11.1% vs local median 5.0% in St. Louis — top-decile yield for the area; either an underpriced asset or a hidden risk that comps aren't pricing in. Stress-test before assuming the spread holds.
Location & tenants
- Location reads: area grade C — affects rentability + tenant quality, not the cash-flow math above.
- St. Louis City (urban): math 10% / reading 18% proficiency, ranked #312 of 324 in MO (top 96%) — low school quality limits family demand, transient renter base, plan for 1-2y turnover; 80% free/reduced lunch — lower-income household profile, screen leases tightly.
- Market conditions: Rents rising fast (+6.2%/yr); 98 active listings in the ZIP; 9 comparable units currently listed for rent nearby; rentals at typical pace (median 15d on market — plan ~3-4 weeks tenant-placement turnaround); solid renter incomes; 294 units permitted in St. Louis city in 2024 (227 in 5+ unit buildings).
- At $6,562/mo this rent would consume 96% of the median local household income ($82k/yr) (locally 921% of renters already pay >50% of income on rent) — very limited rent-growth headroom before tenants either downsize or default.
Forward outlook
- Local home prices are declining (-3.0%/yr); year-one equity from $3k of loan paydown is wiped out by about $15k of value loss. Plan a longer hold.
- St. Louis County population projected to shrink 6% by 2050 — rents likely to lag national; underwrite the cash flow, not the appreciation.
- At projected returns (-3.0% appreciation + 6.2% rent growth), your $140k cash investment doubles in ~6 years — after that, you're playing with house money.
Negotiation context
- It's been on market 78 days — a 6% lower offer ($469k) is reasonable based on typical stale-listing flexibility.
- Current owner paid $180k; list at $499k implies a 177% gain — meaningful room to come down on a strong offer.
Risks & watch-outs
- Watch-outs: built in 1906 — expect roof / HVAC / electrical / plumbing capex.
- Climate carrying-cost: extreme-heat days projected 7→20/yr by 2055 (HVAC capex compounding) — expect insurance premiums to compound above CPI over the hold.
Questions for the listing agent
- It's been on market 78 days. Have you received any prior offers? Is the seller open to a 6% concession, seller financing, or rate buy-down credit?
- Built in 1906 — when were the roof, HVAC, electrical panel, plumbing, and water heater last replaced?
- Why hasn't it sold? Are there any deal-killer items the seller is aware of (foundation, flood, title, zoning, code violations)?
- Is there a deadline driving the sale (1031 exchange, divorce, estate, relocation)? That informs how much negotiation room exists.
- What's the average days-on-market for RENTAL listings here right now (not sales)? A rising rental-DOM trend means longer vacancies and softer asking-rent achievability than the comps imply.
- What's the recent tenant-quality profile in this submarket — average credit score on applications, eviction rate, late-payment / NSF rate, and stable-employment percentage? A property-management company in the area should have these aggregated.
- How much new apartment / multifamily construction is in the pipeline within 1–3 miles? Heavy new supply (>2% of stock underway) typically softens rents 12–24 months out; light construction supports rent growth.
Investment metrics
- 1% rule
- 1.32% ✓
- Cap rate
- 11.14%
- Cash-on-cash
- 17.33%
- DSCR
- 1.77
- GRM
- 6.3
CMA / ARV
- ARV (median comp)
- $378,005
- List price
- $499,000
- Delta
- 32.01%
- Verdict
- OVERPRICED
- Comps
- 20 within 1.0 mi
Show comp detail 12 sales within ~0.75 mi
| Address | Dist | Beds/Ba | Sqft | Sold | Price | $/sf | Match |
|---|---|---|---|---|---|---|---|
| 2715 Arkansas Ave | 0.28mi | 4/4.0 | 3,060 (+9%) | 12mo | $485,000 | $158 | 53 |
| 3818 Wyoming St | 0.75mi | —/— | 2,650 (-5%) | 6mo | $250,000 | $94 | 51 |
| 3433-3435 Juniata St | 0.64mi | 9/6.0 | 3,196 (+14%) | 1mo | $449,900 | $141 | 46 |
| 3662/3664 Wyoming St | 0.73mi | 6/2.0 | 2,754 (-2%) | 2mo | $359,900 | $131 | 45 |
| 2704 Alhambra Ct | 0.24mi | 4/2.0 | 2,420 (-14%) | 10mo | $300,000 | $124 | 42 |
| 3202-3204 Halliday Ave | 0.55mi | 7/3.0 | 3,080 (+10%) | 7mo | $350,000 | $114 | 40 |
| 4212 Castleman Ave | 0.75mi | 4/2.0 | 2,628 (-6%) | 2mo | $425,000 | $162 | 37 |
| 4138 Botanical Ave | 0.56mi | 8/4.0 | 2,450 (-13%) | 10mo | $200,000 | $82 | 37 |
| 3521 Hartford St | 0.54mi | 3/2.0 | 2,448 (-13%) | 3mo | $264,900 | $108 | 35 |
| 3418 Hartford St | 0.62mi | 5/2.0 | 2,528 (-10%) | 6mo | $319,999 | $127 | 34 |
| 4131 Flad Ave | 0.57mi | 4/2.0 | 2,500 (-11%) | 11mo | $415,000 | $166 | 30 |
| 2858 Victor St | 0.74mi | 10/4.0 | 2,474 (-12%) | 11mo | $339,900 | $137 | 29 |
Match score weights: distance 35% · size 25% · config 20% · recency 20%. Top-matched comps best support the ARV.
Projected returns pro-forma
-3.0% appreciation · 6.24% rent growth · sell at horizon
- IRR
- 12.1%
- Equity multiple
- 1.50×
- Total profit
- $69,638
- Equity at exit
- $74,403
- IRR
- 23.4%
- Equity multiple
- 3.31×
- Total profit
- $322,658
- Equity at exit
- $43,144
Cash invested: $139,720 (down + closing). Projections, not guarantees.
Landlord ↔ Tenant lean methodology
- Overall (STATE)
- 81 Strongly Landlord-Friendly
- State Missouri
- 81 Strongly Landlord-Friendly · R+10
- County
- — inherits STATE
- City
- — inherits STATE
ZIP-level market 63110
- Rents YoY
- 6.2%
- Active inventory
- 98
- Price-to-rent
- 38.0×
Monthly cashflow live
- Estimated rent
- $6,562 medium interval (Pro) →
- Mortgage (P&I)
- −$2,617
- Tax from tax record
- −$342 /mo · $4,103/yr
- Insurance
- −$208
- HOA
- −$0
- Vacancy / Maint / Mgmt
- −$1,378
- Net cashflow
- $2,017
Break-even live
6-unit breakdown (identical units grouped — click to expand)
| Units | Beds | Baths | Est. rent |
|---|---|---|---|
| 6× units | 1 | 1 | $6,564 |
| #1 | 1 | 1 | $1,094 |
| #2 | 1 | 1 | $1,094 |
| #3 | 1 | 1 | $1,094 |
| #4 | 1 | 1 | $1,094 |
| #5 | 1 | 1 | $1,094 |
| #6 | 1 | 1 | $1,094 |
| Total (6 units) | $6,562 | ||
UW: 25.0% down · 7.5% · 30yr · 1.5% tax · 5.0% vac · 8.0% maint · 8.0% mgmt
Financing live
Cash to close
- Down payment
- $124,750
- Closing costs
- $14,970
- Reserves months
- —
- Total cash needed
- —
Loan-product check · same deal, 3 products live
Conventional
25% down · 7.5% · 30yr
- Down + closing
- —
- Monthly P&I
- —
- Monthly cashflow
- —
- DSCR
- —
- Eligible?
- —
Personal DTI + credit; lowest rate.
DSCR
20% down · 8.5% · 30yr
- Down + closing
- —
- Monthly P&I
- —
- Monthly cashflow
- —
- DSCR
- —
- Eligible?
- —
No personal income docs; deal must DSCR.
Hard money
10% down · 12.0% · 12mo
- Down + closing
- —
- Monthly P&I
- —
- Monthly cashflow
- —
- DSCR
- —
- Eligible?
- —
Short-term bridge; refi at stabilization.
Rent comps 9 comps
| Address | Beds | Baths | Sqft | Rent | $/sqft | DOM | Units | Dist |
|---|---|---|---|---|---|---|---|---|
| 3228 Arsenal St Unit 1f St. Louis, MO | 2.0 | 1.0 | 2702 | $1,395 | $0.52 | 23d | 1 | 0.66mi |
| 3908 McDonald Ave Saint Louis, MO | 3.0 | 2.0 | 1927 | $2,500 | $1.30 | 4d | 1 | 1.01mi |
| 3458 Giles Ave Saint Louis, MO | 3.0 | 2.5 | 2204 | $2,400 | $1.09 | 7d | 1 | 1.07mi |
| 3807 Potomac St Saint Louis, MO | 3.0 | 1.0 | 2588 | $1,100 | $0.43 | 43d | 1 | 1.11mi |
| 3807 Potomac St Saint Louis, MO | 3.0 | 1.0 | 2588 | $1,300 | $0.50 | 7d | 1 | 1.11mi |
| 2643 Wyoming St Saint Louis, MO | 3.0 | 2.5 | 2592 | $2,600 | $1.00 | 43d | 1 | 1.25mi |
| 3653 S Grand Blvd Saint Louis, MO | 1.0 | 1.0 | 2050 | $1,350 | $0.66 | 1d | 4 | 1.32mi |
| 3429 Ohio Ave Saint Louis, MO | 3.0 | 3.0 | 1938 | $2,250 | $1.16 | 16d | 1 | 1.44mi |
| 2035 Allen Ave Saint Louis, MO | 2.0 | 2.0 | 2974 | $1,625 | $0.55 | 14d | 1 | 1.46mi |
Listing history 16 events
-
2026-06-18days on market $499,000 Active 78 DOM
-
2026-06-17days on market $499,000 Active 77 DOM
-
2026-06-16days on market $499,000 Active 76 DOM
-
2026-06-15days on market $499,000 Active 75 DOM
-
2026-06-13days on market $499,000 Active 73 DOM
-
2026-06-09days on market $499,000 Active 69 DOM
-
2026-06-08days on market $499,000 Active 68 DOM
-
2026-06-08days on market $499,000 Active 67 DOM
-
2026-06-05days on market $499,000 Active 64 DOM
-
2026-06-03days on market $499,000 Active 63 DOM
-
2026-06-02days on market $499,000 Active 62 DOM
-
2026-06-01days on market $499,000 Active 61 DOM
-
2026-05-31days on market $499,000 Active 60 DOM
-
2026-04-01$499,000 Active 1088-char remark
Show marketing remark (1088 chars)
Investor Alert! Welcome to this fully rented, gorgeous multifamily building just blocks from Tower Grove Park! Step inside to a clean and updated first and second floor common hallway. This sale is composed of only the west half of this building and has 6 efficient units that have high potential for rent increases and improvements. 3 units on the second floor, and 3 units on the first floor. Perfect for SLU students, Barnes Jewish/Cardinal Glennon employees or any of other prospects vying to live in Shaw at an affordable price. Several updates throughout the building and in a couple units (see supplements). Both floors have direct access to the fully, unfinished basement. There is no laundry and could be added for some easy extra income. Several tenants are going on their second year here. Whether you want to keep it for long-term cash flow, renovate and resale, or explore short term rentals, this property offers many exit strategies. Owner currently pays all utilities for tenants with no RUBS (again, an easy opportunity for more cash flow). Please do not disturb tenants.
-
2005-07-25soldstatus $180,000
-
1994-05-09soldstatus
ⓘ Source: listings_history table (triggers on properties + properties_extension) + one-shot
backfill from property_details.listing_events for pre-trigger history.
Tax reassessment forecast MO · Resets to sale price
- Current annual tax
- $4,103 · $342/mo
- Projected year-2 tax
- $4,840 · $403/mo
- Expected delta
- +$737/yr (+$61/mo · 18.0%)
ⓘ Screening estimate from a state-policy table — verify with the county assessor before closing.
Climate risk First Street
- Flood 1/10 Low FEMA zone X (unshaded) · 0% chance over 30 yrs
- Wildfire 1/10 Low
- Heat 5/10 Major 7 d/yr ≥108°F today · 20 d/yr by 30 yrs out
- Wind 2/10 Low 100% chance of damaging wind over 30 yrs
- Air quality 3/10 Moderate 3 unhealthy d/yr today · 4 by 30 yrs out
Nearby sold comps map
Loading sold comps map…
Walkable amenities ~0.75 mi
Loading nearby amenities…
Taxation est. · year 1
- Rental income
- $78,744
- − Mortgage interest
- −$27,952
- − Property taxes
- −$4,103
- − Insurance
- −$2,495
- − Repairs & maintenance
- −$6,300
- − Management
- −$6,300
- − Depreciation
- −$14,516
- Taxable income
- $17,079
- Est. tax owed @ 24.0%
- −$4,099
- After-tax cash flow
- $20,109/yr
For passive investors: Depreciation is non-cash, so a rental often shows a tax loss while cash-flowing — sheltering income. Rental losses are passive: they offset passive income freely, and up to $25,000/yr can offset ordinary (W-2) income if you actively participate and your MAGI is under $100k (phasing out to $0 by $150k); unused losses carry forward. On sale, claimed depreciation is recaptured at up to 25%, and gains may owe capital-gains tax (a 1031 exchange can defer both). Figures are a year-1 estimate at your 24.0% rate — not tax advice; consult a CPA.
Schools (NCES district)
- District
- St. Louis City
- NCES district ID
- 2929280
- Math proficiency
- 10% ▼ -6.00%
- Reading proficiency
- 18% ▼ -3.00%
- Median HH income
- $35,685
- Composite
- 11.54/100
- National rank
- #9699
- State rank
- #312 of 324 in MO
Livability — St. Louis
No livability data for this city. (Only ~50 U.S. cities are tracked.)
Census & demographics
- Census place
- St. Louis, MO
- County
- Saint Louis City · 254,015 people
- City population
- 283,259
- Metro
- St. Louis, MO-IL
- Population (ZIP)
- 17,645
- Household income
- $81,655
- Rent vs Own
- Severe rent burden
- 921.0
Population outlook (St. Louis County) Hauer SSP2
- Today (2025)
- 315,737 people
- By 2030
- 313,865 · -0.6%
- By 2040
- 305,439 · -3.3%
- By 2050
- 296,529 · -6.1%
- By 2075
- 271,028 · -14.2%
- By 2100
- 255,359 · -19.1%
Race, ethnicity, and origin ACS 2023
- Neighborhood character
- Majority White (65%)
- Race & ethnicity
- White 65% Black 19% Two or more races 9% Hispanic / Latino 8% Asian 4%
- Hispanic origin (detail)
- Mexican 5%
- Common ancestry
- Lithuanian 5% Slovak 3% Italian 3%
- Foreign-born
- 6% · Canada, China, South Korea
- Languages at home
- 91% English-only · Spanish 3% French/Haitian/Cajun 1% Other Asian/Pacific 1%
Political lean MEDSL · St. Louis
- 2024 margin
- Solid D (+64.7) · D 81.4% · R 16.7% · Other 2.0%
- 2008→2024 swing
- -3.5pp toward R · 2008: 68.2pp · 2024: 64.7pp
- All cycles
- 2024: D+64.7 2020: D+66.2 2016: D+63.7 2012: D+66.6 2008: D+68.2
Not yet ingested
- Civics
- —
Market trends
- HPI YoY
- ▼ -206.93%
- Current HPI
- 342.2466
- Rent YoY
- ▲ 6.24%
- Metro
- St. Louis, MO-IL
- State GDP YoY
- ▲ 1.84%
- F500 in state
- 20
Industry mix (Fortune 500 HQ in MO)
| Industry | F500 HQs | Revenue |
|---|---|---|
| Healthcare | 1 | $163B |
|
||
| Insurance | 1 | $21B |
|
||
| Industrial Technology | 1 | $17B |
|
||
| Retail | 1 | $16B |
|
||
| Industrial Distribution | 1 | $10B |
|
||
| Utilities | 1 | $9B |
|
||
Price history
+177.2% since first listed3 events — show timeline
- 2026-04-01 Listed $499,000 MARIS as Distributed by MLS Grid
- 2005-07-25 Sold (Public Records) $180,000 Public Records
- 1994-05-09 Sold (Public Records) — Public Records
Property tax history
+6.7%/yrLatest (2024): $4,103 · +5.1% YoY. Source: county tax records.
Cash-flow waterfall
monthlySold comps — $/sqft
last 12 mo · ≤1 miLoading sold comps…