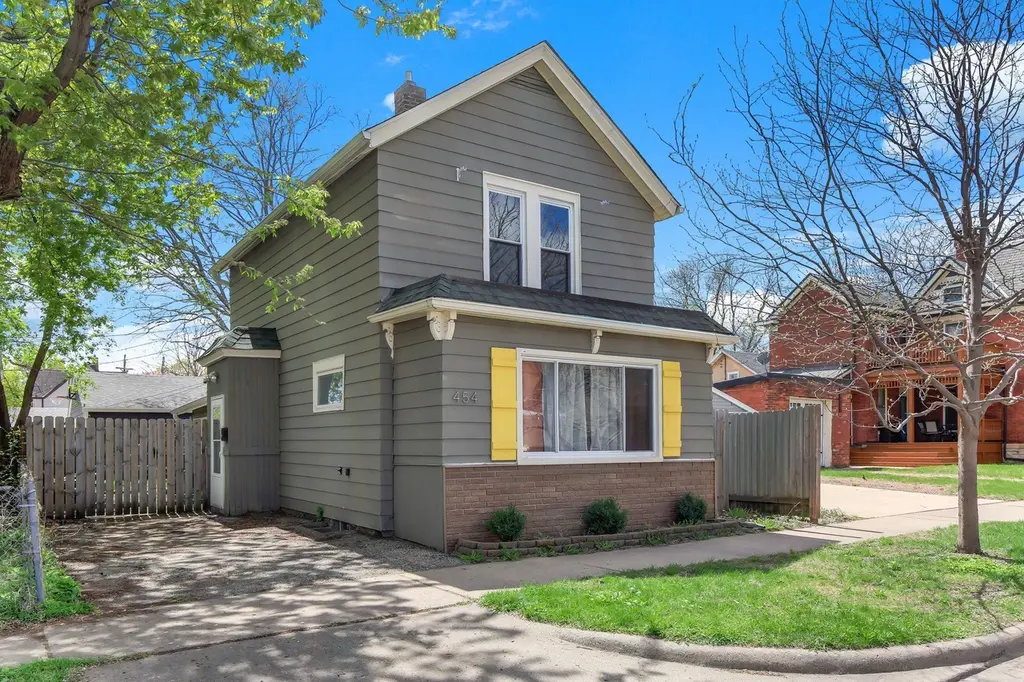
454 Michigan St
St. Paul, MN 55102
$245,000B-
3 bd · 1.0 ba ·
1,308 sqft ·
Built 1870
· SingleFamily
· Active
· 21 DOM
Cashflow @ list (25.0% down · 7.5%)
Estimated rent
$2,936/mo
Mortgage (P&I)
−$1,285
Tax + insurance
−$379
HOA
−$0
Vac / Maint / Mgmt
−$617
Net cashflow
$656/mo
Annual
$7,873/yr
Cap rate
9.51%
Cash-on-cash
11.48%
DSCR
1.51
1% rule
1.20%
Cash to close
$68,600
Investor read
- This is a 3-bed/1.0-bath single-family listed at $245k.
- At list price, monthly cash flow is $656 ($8k/yr) — positive.
- The deal already cash-flows at list — no discount required.
- Meets the 1% rule at list price ($3k rent vs $245k).
- It's been on market 21 days — a 2% lower offer ($241k) is reasonable based on typical stale-listing flexibility.
- Recommended offer: $241k (1.5% below list) — sets the bar for market timing.
- Local home prices are declining (-3.0%/yr); year-one equity from $2k of loan paydown is wiped out by about $7k of value loss. Plan a longer hold.
- Location reads: area grade B — affects rentability + tenant quality, not the cash-flow math above.
- St. Paul Public School District (urban): math 21% / reading 33% proficiency, ranked #270 of 301 in MN (top 90%) — low school quality limits family demand, transient renter base, plan for 1-2y turnover; 64% free/reduced lunch — lower-income household profile, screen leases tightly.
- Zoned schools: Randolph Heights Elementary (math 62% / reading 62%, grade B, #180 of 857 statewide, top 23%, 437 students, 31% FRL); Hidden River Middle School (math 21% / reading 39%, grade F, #199 of 258 statewide, top 78%, 559 students, 61% FRL); Central Senior High (math 52% / reading 67%, grade C+, #46 of 471 statewide, top 11%, 1,691 students, 49% FRL) — zoned schools average 47% FRL vs 64% district-wide (17 pts lower); this property's tenant base skews higher-income than the district average.
- Zoned-school proficiency averages 50% at this address vs 27% district-wide (+24 pts) — the actual schools serving this property are materially stronger than the St. Paul Public School District average implies; a family-tenant draw the district grade alone would hide.
- Watch-outs: built in 1870 — expect roof / HVAC / electrical / plumbing capex.
- Market conditions: Rents rising (+1.6%/yr); 148 active listings in the ZIP; 6 comparable units currently listed for rent nearby; rentals leasing fast (median 4d on market — plan ~1-2 weeks tenant-placement turnaround); solid renter incomes; 1,202 units permitted in Ramsey County in 2024 (880 in 5+ unit buildings).
- Ramsey County population projected at +27% by 2050 — long-run rental-demand tailwind backs the buy-and-hold thesis.
- 12 sale attempts since 31y ago with the ask held roughly flat each time — persistent listings suggest the price (not the market) is what's stuck; bring a comps-based counter.
- At $2,936/mo this rent would consume 46% of the median local household income ($76k/yr) (locally 1116% of renters already pay >50% of income on rent) — very limited rent-growth headroom before tenants either downsize or default.
Questions for listing agent
- Built in 1870 — when were the roof, HVAC, electrical panel, plumbing, and water heater last replaced?
- Is there a deadline driving the sale (1031 exchange, divorce, estate, relocation)? That informs how much negotiation room exists.
- What's the average days-on-market for RENTAL listings here right now (not sales)? A rising rental-DOM trend means longer vacancies and softer asking-rent achievability than the comps imply.
- What's the recent tenant-quality profile in this submarket — average credit score on applications, eviction rate, late-payment / NSF rate, and stable-employment percentage? A property-management company in the area should have these aggregated.
- How much new for-sale + rental construction is in the pipeline within 1–3 miles? Heavy new supply typically softens prices + rents 12–24 months out; constrained supply supports both.
CashFlowRE · CFR-KYV8B18VNZ5ZDD
· Data 19 h ago
cashflowre.app · 2026-05-29