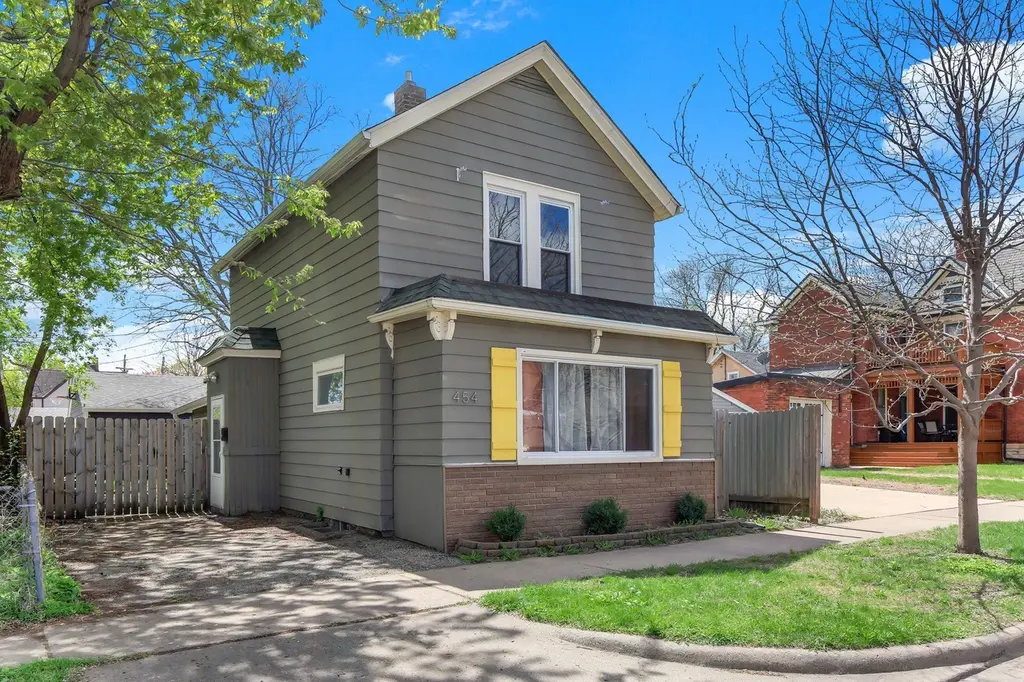
454 Michigan St · St. Paul, MN
Flood risk 1/10 · Minimal
- FEMA flood zone
- X (unshaded)
- Chance of flooding over 30 yrs
- 0.0%
- Est. flood insurance / yr
- $507 – $1,088
Fire risk 1/10 · Minimal
- Est. fire insurance / yr
- $888 – $1,650
Heat risk 2/10 · Minimal
- Hot days now (above 100°F)
- 7 days/yr
- Hot days in 30 yrs
- 14 days/yr
Wind risk 2/10 · Minimal
- Chance of severe wind over 30 yrs
- —
Air-quality risk 2/10 · Minimal
- Unhealthy air days now
- 1 days/yr
- Unhealthy air days in 30 yrs
- 1 days/yr
Risk factors via First Street. Map © Google.
Why this score? — see what drove the B- grade
The composite is a weighted blend of 9 inputs, each scored 0–100. Each bar is that input's sub-score; the figure is the points it added to the 100-point composite (weight × sub-score).
- Cash flow +26.6/30.0
- ARV discount +15.0/15.0
- DSCR +9.1/10.0
- 1% rule +7.0/10.0
- Rent growth +2.9/5.0
- Livability +2.5/5.0
- Condition / age +2.5/5.0
- Schools +2.4/10.0
- Appreciation +0.0/10.0
$245,000
🖨 Deal sheet (PDF) 📄 Offer letter ✓ Due diligence
Listing remarks
Upated main and upper levels, cute & clean and fun location! Newer paint, carpet, stainless appliances. Expanded cabinets added along with beautiful new countertops. Mud room/storage area has new tile flooring. New carpet just installed upstairs. Full bath has ceramic tile surround, walks thru to one BR. 2021 electrical panel, most all windows are vinyl double pane windows. Easy maintenance, gas f/a heat, great fenced yard with firepit area. Owners have loved the walkability and quiet neighborhood. Ideal location near 35E, west 7th restaurants, 2 blocks to Asian market, 3 blocks to Montessori school. Great 1st home or sizing-down home. Easy to show. All in a popular and quiet area, gr
Key facts
- New tile flooring
- Expanded cabinets
- Stainless appliances
Tags
Property features AI
Finance
- Financial info: FHA mortgage type
Exterior
- Parking: Asphalt parking
- Utilities: City water (connected); City sewer (connected); Natural gas; Electric with circuit breakers
- Home design: Residential property; Two levels; Stone foundation
- Construction: Asphalt roof; Stone foundation; Exterior includes metal, vinyl and wood
- Exterior features: Patio; Full wood fencing; Metal, vinyl and wood exterior surfaces; Medium tree coverage
Interior
- Kitchen: Kitchen with window; Refrigerator; Range; Microwave; Dishwasher
- Bedrooms: 3 bedrooms (all on upper level)
- Flooring: Hardwood; Tile
- Bathrooms: 1 full bathroom (upper level)
- Heating & cooling: Forced air heating; Window unit(s) for cooling
- Interior features: Hardwood floors; Tile floors; Eat-in kitchen and separate/formal dining room; Full unfinished basement
- Laundry & utility: Washer and dryer hookups on main level; Washer; Dryer
Neighborhood map
What this means for you Summary
Snapshot
- This is a 3-bed/1.0-bath single-family listed at $245k.
Deal economics
- At list price, monthly cash flow is $656 ($8k/yr) — positive.
- The deal already cash-flows at list — no discount required.
- Meets the 1% rule at list price ($3k rent vs $245k).
- Recommended offer: $241k (1.5% below list) — sets the bar for market timing.
Location & tenants
- Location reads: area grade B — affects rentability + tenant quality, not the cash-flow math above.
- St. Paul Public School District (urban): math 21% / reading 33% proficiency, ranked #270 of 301 in MN (top 90%) — low school quality limits family demand, transient renter base, plan for 1-2y turnover; 64% free/reduced lunch — lower-income household profile, screen leases tightly.
- Zoned schools: Randolph Heights Elementary (math 62% / reading 62%, grade B, #180 of 857 statewide, top 23%, 437 students, 31% FRL); Hidden River Middle School (math 21% / reading 39%, grade F, #199 of 258 statewide, top 78%, 559 students, 61% FRL); Central Senior High (math 52% / reading 67%, grade C+, #46 of 471 statewide, top 11%, 1,691 students, 49% FRL) — zoned schools average 47% FRL vs 64% district-wide (17 pts lower); this property's tenant base skews higher-income than the district average.
- Zoned-school proficiency averages 50% at this address vs 27% district-wide (+24 pts) — the actual schools serving this property are materially stronger than the St. Paul Public School District average implies; a family-tenant draw the district grade alone would hide.
- Market conditions: Rents rising (+1.6%/yr); 148 active listings in the ZIP; 6 comparable units currently listed for rent nearby; rentals leasing fast (median 4d on market — plan ~1-2 weeks tenant-placement turnaround); solid renter incomes; 1,202 units permitted in Ramsey County in 2024 (880 in 5+ unit buildings).
- At $2,936/mo this rent would consume 46% of the median local household income ($76k/yr) (locally 1116% of renters already pay >50% of income on rent) — very limited rent-growth headroom before tenants either downsize or default.
Forward outlook
- Local home prices are declining (-3.0%/yr); year-one equity from $2k of loan paydown is wiped out by about $7k of value loss. Plan a longer hold.
- Ramsey County population projected at +27% by 2050 — long-run rental-demand tailwind backs the buy-and-hold thesis.
Negotiation context
- It's been on market 21 days — a 2% lower offer ($241k) is reasonable based on typical stale-listing flexibility.
- 12 sale attempts since 31y ago with the ask held roughly flat each time — persistent listings suggest the price (not the market) is what's stuck; bring a comps-based counter.
Risks & watch-outs
- Watch-outs: built in 1870 — expect roof / HVAC / electrical / plumbing capex.
Questions for the listing agent
- Built in 1870 — when were the roof, HVAC, electrical panel, plumbing, and water heater last replaced?
- Is there a deadline driving the sale (1031 exchange, divorce, estate, relocation)? That informs how much negotiation room exists.
- What's the average days-on-market for RENTAL listings here right now (not sales)? A rising rental-DOM trend means longer vacancies and softer asking-rent achievability than the comps imply.
- What's the recent tenant-quality profile in this submarket — average credit score on applications, eviction rate, late-payment / NSF rate, and stable-employment percentage? A property-management company in the area should have these aggregated.
- How much new for-sale + rental construction is in the pipeline within 1–3 miles? Heavy new supply typically softens prices + rents 12–24 months out; constrained supply supports both.
Investment metrics
- 1% rule
- 1.20% ✓
- Cap rate
- 9.51%
- Cash-on-cash
- 11.48%
- DSCR
- 1.51
- GRM
- 7.0
CMA / ARV
- ARV (median comp)
- $334,078
- List price
- $245,000
- Delta
- -26.66%
- Verdict
- UNDERPRICED
- Comps
- 2 within 2.0 mi
Projected returns pro-forma
-3.0% appreciation · 1.6% rent growth · sell at horizon
- IRR
- -0.8%
- Equity multiple
- 0.97×
- Total profit
- $-1,968
- Equity at exit
- $36,530
- IRR
- 7.4%
- Equity multiple
- 1.52×
- Total profit
- $35,923
- Equity at exit
- $21,183
Cash invested: $68,600 (down + closing). Projections, not guarantees.
Landlord ↔ Tenant lean methodology
- Overall (STATE)
- 46 Balanced
- State Minnesota
- 46 Balanced · D+2
- County
- — inherits STATE
- City
- — inherits STATE
ZIP-level market 55102
- Rents YoY
- 1.6%
- Active inventory
- 148
- Price-to-rent
- 7.0×
Monthly cashflow live
- Estimated rent
- $2,936 high interval (Pro) →
- Mortgage (P&I)
- −$1,285
- Tax from tax record
- −$276 /mo · $3,318/yr
- Insurance
- −$102
- HOA
- −$0
- Vacancy / Maint / Mgmt
- −$617
- Net cashflow
- $656
Break-even live
Sensitivity live
| Price | -10% $795 | -5% $725 | +0% $656 | +5% $587 | +10% $517 |
|---|---|---|---|---|---|
| Rent | -10% $424 | -5% $540 | +0% $656 | +5% $772 | +10% $888 |
| Rate | -1.0pp $779 | -0.5pp $718 | base $656 | +0.5pp $593 | +1.0pp $528 |
UW: 25.0% down · 7.5% · 30yr · 1.5% tax · 5.0% vac · 8.0% maint · 8.0% mgmt
Financing live
Cash to close
- Down payment
- $61,250
- Closing costs
- $7,350
- Reserves months
- —
- Total cash needed
- —
Loan-product check · same deal, 3 products live
Conventional
25% down · 7.5% · 30yr
- Down + closing
- —
- Monthly P&I
- —
- Monthly cashflow
- —
- DSCR
- —
- Eligible?
- —
Personal DTI + credit; lowest rate.
DSCR
20% down · 8.5% · 30yr
- Down + closing
- —
- Monthly P&I
- —
- Monthly cashflow
- —
- DSCR
- —
- Eligible?
- —
No personal income docs; deal must DSCR.
Hard money
10% down · 12.0% · 12mo
- Down + closing
- —
- Monthly P&I
- —
- Monthly cashflow
- —
- DSCR
- —
- Eligible?
- —
Short-term bridge; refi at stabilization.
Rent comps 6 comps
| Address | Beds | Baths | Sqft | Rent | $/sqft | DOM | Units | Dist |
|---|---|---|---|---|---|---|---|---|
| 380 Randolph Ave Saint Paul, MN | 2.0 | 1.0–2.0 | 753 | $2,946 | $3.91 | 1d | 18 | 0.57mi |
| 400 Spring St Saint Paul, MN | 1.0–2.0 | 1.0–2.0 | 1205 | $3,275 | $2.72 | 1d | 32 | 0.70mi |
| 255 Western Ave N Saint Paul, MN | 3.0 | 1.0–2.0 | 1049 | $3,700 | $3.53 | 3d | 23 | 0.97mi |
| 253 Kellogg Blvd W Saint Paul, MN | 2.0 | 1.0–2.0 | 1208 | $3,198 | $2.65 | 4d | 12 | 1.09mi |
| 740 Victoria St S Saint Paul, MN | 3.0 | 1.0–2.0 | 1076 | $3,562 | $3.31 | 0d | 38 | 1.36mi |
| 470 Lexington Pkwy S Saint Paul, MN | 2.0 | 1.0–2.0 | 1175 | $3,500 | $2.98 | 3d | 19 | 1.42mi |
Listing history 50 events
-
2026-06-21days on market $245,000 Active 21 DOM
-
2026-06-18days on market $245,000 Active 18 DOM
-
2026-06-17days on market $245,000 Active 17 DOM
-
2026-06-16days on market $245,000 Active 16 DOM
-
2026-06-15days on market $245,000 Active 15 DOM
-
2026-06-13days on market $245,000 Active 13 DOM
-
2026-06-09days on market $245,000 Active 9 DOM
-
2026-06-08days on market $245,000 Active 8 DOM
-
2026-06-07days on market $245,000 Active 7 DOM
-
2026-06-04days on market $245,000 Active 4 DOM
-
2026-06-03days on market $245,000 Active 3 DOM
-
2026-06-02days on market $245,000 Active 2 DOM
-
2026-06-02price $245,000 Active 1 DOM
-
2026-06-01pricestatusdays on market $247,500 Active 1 DOM
-
2026-05-11historical Contingent - Inspection 717-char remark
-
2026-04-11status Active 717-char remark
-
2026-04-05historical Contingent - Inspection 717-char remark
-
2026-03-31$245,000 Active 717-char remark
-
2026-02-21price $244,000
-
2026-02-10price $249,500
-
2026-01-26$255,000 Active
-
2026-01-26historical
-
2026-01-03price $269,900
-
2025-12-03$275,000 Active
-
2021-11-03soldstatus $217,000
-
2021-10-29soldstatus $217,000 Sold
-
2021-09-16status Pending
-
2021-09-05historical Contingent - Inspection
-
2021-09-02$210,000 Active
-
2021-08-31historical $210,000
-
2017-10-13soldstatus $160,000 Sold
-
2017-08-28status Pending
-
2017-08-19status Active
-
2017-08-13historical Contingent - Inspection
-
2017-08-11$159,900 Active
-
2016-03-29soldstatus $67,500
-
2016-03-25soldstatus $67,500 Sold
-
2016-01-21historical Contingent - Other
-
2016-01-15$63,800 Active
-
2016-01-15historical
-
2015-11-07historical Contingent - Third Party Approval
-
2015-09-03price $69,900
-
2015-07-10price $79,900
-
2015-06-29status Active
-
2015-06-10historical Contingent - Third Party Approval
-
2015-06-03price $89,900
-
2015-03-14$99,900 Active
-
2001-02-28soldstatus $80,000
-
1996-01-23soldstatus $42,500
-
1995-11-27soldstatus $42,400
ⓘ Source: listings_history table (triggers on properties + properties_extension) + one-shot
backfill from property_details.listing_events for pre-trigger history.
Tax reassessment forecast MN · Partial reset (capped growth)
- Current annual tax
- $3,318 · $276/mo
- Projected year-2 tax
- $3,318 · $276/mo
- Expected delta
- $0/yr ($0/mo · 0.0%)
ⓘ Screening estimate from a state-policy table — verify with the county assessor before closing.
Climate risk First Street
- Flood 1/10 Low FEMA zone X (unshaded) · 0% chance over 30 yrs
- Wildfire 1/10 Low
- Heat 2/10 Low 7 d/yr ≥100°F today · 14 d/yr by 30 yrs out
- Wind 2/10 Low
- Air quality 2/10 Low 1 unhealthy d/yr today · 1 by 30 yrs out
Nearby sold comps map
Loading sold comps map…
Walkable amenities ~0.75 mi
Loading nearby amenities…
Taxation est. · year 1
- Rental income
- $35,232
- − Mortgage interest
- −$13,724
- − Property taxes
- −$3,318
- − Insurance
- −$1,225
- − Repairs & maintenance
- −$2,819
- − Management
- −$2,819
- − Depreciation
- −$7,127
- Taxable income
- $4,201
- Est. tax owed @ 24.0%
- −$1,008
- After-tax cash flow
- $6,865/yr
For passive investors: Depreciation is non-cash, so a rental often shows a tax loss while cash-flowing — sheltering income. Rental losses are passive: they offset passive income freely, and up to $25,000/yr can offset ordinary (W-2) income if you actively participate and your MAGI is under $100k (phasing out to $0 by $150k); unused losses carry forward. On sale, claimed depreciation is recaptured at up to 25%, and gains may owe capital-gains tax (a 1031 exchange can defer both). Figures are a year-1 estimate at your 24.0% rate — not tax advice; consult a CPA.
Schools (NCES district)
- District
- St. Paul Public School District
- NCES district ID
- 2733840
- Math proficiency
- 21% ▼ -11.00%
- Reading proficiency
- 33% ▼ -7.00%
- Median HH income
- $48,316
- Composite
- 23.51/100
- National rank
- #7868
- State rank
- #270 of 301 in MN
Livability — St. Paul
No livability data for this city. (Only ~50 U.S. cities are tracked.)
Census & demographics
- Census place
- St. Paul, MN
- County
- Ramsey County · 542,837 people
- City population
- 280,599
- Metro
- Minneapolis-St. Paul-Bloomington, MN-WI
- Population (ZIP)
- 19,630
- Household income
- $76,406
- Rent vs Own
- Severe rent burden
- 1116.0
Population outlook (Ramsey County) Hauer SSP2
- Today (2025)
- 603,431 people
- By 2030
- 636,459 · +5.5%
- By 2040
- 700,596 · +16.1%
- By 2050
- 765,819 · +26.9%
- By 2075
- 929,297 · +54.0%
- By 2100
- 1,053,924 · +74.7%
Race, ethnicity, and origin ACS 2023
- Neighborhood character
- Predominantly White (77%)
- Race & ethnicity
- White 77% Black 10% Two or more races 6% Hispanic / Latino 5% Asian 3%
- Hispanic origin (detail)
- Mexican 4%
- Common ancestry
- Portuguese 10% Lithuanian 5% Romanian 3%
- Foreign-born
- 9% · Canada, South Korea
- Languages at home
- 87% English-only · Spanish 4% Other Indo-European 1% German/W. Germanic 1%
Political lean MEDSL · Ramsey
- 2024 margin
- Solid D (+43.3) · D 70.5% · R 27.2% · Other 2.3%
- 2008→2024 swing
- +9.4pp toward D · 2008: 33.9pp · 2024: 43.3pp
- All cycles
- 2024: D+43.3 2020: D+45.4 2016: D+39.4 2012: D+35.3 2008: D+33.9
Not yet ingested
- Civics
- —
Market trends
- HPI YoY
- ▼ -217.83%
- Current HPI
- 241.7112
- Rent YoY
- ▲ 1.60%
- Metro
- Minneapolis-St. Paul-Bloomington, MN-WI
- State GDP YoY
- ▲ 2.41%
- F500 in state
- 34
Industry mix (Fortune 500 HQ in MN)
| Industry | F500 HQs | Revenue |
|---|---|---|
| Healthcare | 2 | $407B |
|
||
| Retail | 2 | $150B |
|
||
| Consumer Goods | 2 | $32B |
|
||
| Industrial Machinery | 2 | $6B |
|
||
| Agriculture | 1 | $40B |
|
||
| Healthcare / Medical Devices | 1 | $32B |
|
||
Price history
+458.1% since first listed40 events — show timeline
- 2026-06-01 Price Changed $245,000 NORTHSTARMLS as Distributed by MLS Grid
- 2026-05-31 Listed $247,500 NORTHSTARMLS as Distributed by MLS Grid
- 2026-05-11 Contingent — NORTHSTARMLS as Distributed by MLS Grid
- 2026-04-11 Relisted — NORTHSTARMLS as Distributed by MLS Grid
- 2026-04-05 Contingent — NORTHSTARMLS as Distributed by MLS Grid
- 2026-03-31 Listed $245,000 NORTHSTARMLS as Distributed by MLS Grid
- 2026-02-21 Price Changed $244,000 NORTHSTARMLS as Distributed by MLS Grid
- 2026-02-10 Price Changed $249,500 NORTHSTARMLS as Distributed by MLS Grid
- 2026-01-26 Listing Removed — NORTHSTARMLS as Distributed by MLS Grid
- 2026-01-26 Listed $255,000 NORTHSTARMLS as Distributed by MLS Grid
- 2026-01-03 Price Changed $269,900 NORTHSTARMLS as Distributed by MLS Grid
- 2025-12-03 Listed $275,000 NORTHSTARMLS as Distributed by MLS Grid
- 2021-11-03 Sold (Public Records) $217,000 Public Records
- 2021-10-29 Sold (MLS) $217,000 NORTHSTARMLS as Distributed by MLS Grid
- 2021-09-16 Pending — NORTHSTARMLS as Distributed by MLS Grid
- 2021-09-05 Contingent — NORTHSTARMLS as Distributed by MLS Grid
- 2021-09-02 Listed $210,000 NORTHSTARMLS as Distributed by MLS Grid
- 2021-08-31 Coming Soon $210,000 NORTHSTARMLS as Distributed by MLS Grid
- 2017-10-13 Sold (MLS) $160,000 NORTHSTARMLS as Distributed by MLS Grid
- 2017-08-28 Pending — NORTHSTARMLS as Distributed by MLS Grid
- 2017-08-19 Relisted — NORTHSTARMLS as Distributed by MLS Grid
- 2017-08-13 Contingent — NORTHSTARMLS as Distributed by MLS Grid
- 2017-08-11 Listed $159,900 NORTHSTARMLS as Distributed by MLS Grid
- 2016-03-29 Sold (Public Records) $67,500 Public Records
- 2016-03-25 Sold (MLS) $67,500 NORTHSTARMLS as Distributed by MLS Grid
- 2016-01-21 Contingent — NORTHSTARMLS as Distributed by MLS Grid
- 2016-01-15 Listed $63,800 NORTHSTARMLS as Distributed by MLS Grid
- 2016-01-15 Listing Removed — NORTHSTARMLS as Distributed by MLS Grid
- 2015-11-07 Contingent — NORTHSTARMLS as Distributed by MLS Grid
- 2015-09-03 Price Changed $69,900 NORTHSTARMLS as Distributed by MLS Grid
- 2015-07-10 Price Changed $79,900 NORTHSTARMLS as Distributed by MLS Grid
- 2015-06-29 Relisted — NORTHSTARMLS as Distributed by MLS Grid
- 2015-06-10 Contingent — NORTHSTARMLS as Distributed by MLS Grid
- 2015-06-03 Price Changed $89,900 NORTHSTARMLS as Distributed by MLS Grid
- 2015-03-14 Listed $99,900 NORTHSTARMLS as Distributed by MLS Grid
- 2001-02-28 Sold (Public Records) $80,000 Public Records
- 1996-01-23 Sold (Public Records) $42,500 Public Records
- 1995-11-27 Sold (MLS) $42,400 NORTHSTARMLS as Distributed by MLS Grid
- 1995-10-27 Listing Removed — NORTHSTARMLS as Distributed by MLS Grid
- 1995-09-15 Listed $43,900 NORTHSTARMLS as Distributed by MLS Grid
Property tax history
+4.6%/yrLatest (2025): $3,318 · +4.0% YoY. Source: county tax records.
Cash-flow waterfall
monthlySold comps — $/sqft
last 12 mo · ≤1 miLoading sold comps…