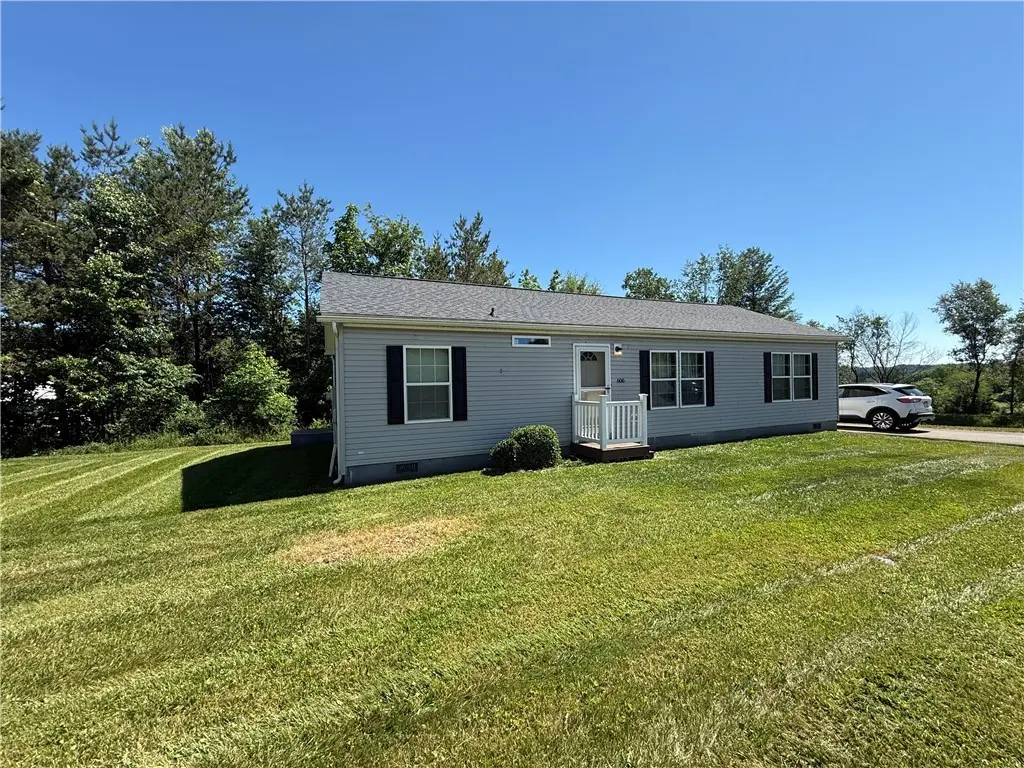
606 Ashley Dr
White, PA 15701
$149,000F
3 bd · 2.0 ba ·
1,300 sqft ·
Built 2019
· Manufactured
· Active
· 4 DOM
Cashflow @ list (25.0% down · 7.5%)
Estimated rent
$943/mo
Mortgage (P&I)
−$781
Tax + insurance
−$210
HOA
−$0
Vac / Maint / Mgmt
−$198
Net cashflow
$-247/mo
Annual
$-2,960/yr
Cap rate
4.31%
Cash-on-cash
-7.09%
DSCR
0.68
1% rule
0.63%
Cash to close
$41,720
Investor read
- This is a 3-bed/2.0-bath manufactured listed at $149k.
- At list price, monthly cash flow is $-247 ($-3k/yr) — negative.
- To cash-flow at today's rent, offer at most $105k (29.2% below list).
- To meet the 1% rule (rent ≥ 1% of price), the offer needs to be $94k (36.7% below list).
- Only 4 days on market — expect competitive offers; lowballing is unlikely to land.
- Recommended offer: $94k (36.7% below list) — sets the bar for 1% rule.
- Local home prices are declining (-3.0%/yr); year-one equity from $1k of loan paydown is wiped out by about $4k of value loss. Plan a longer hold.
- Location reads: area grade F — affects rentability + tenant quality, not the cash-flow math above.
- Indiana Area SD (town): math 49% / reading 67% proficiency, ranked #96 of 539 in PA (top 18%) — acceptable for families but not a draw, mixed tenant base, ~2y average lease.
- Zoned schools: Ben Franklin El Sch (math 47% / reading 62%, grade C, #504 of 1,518 statewide, top 37%, 393 students, 56% FRL); Indiana Area Jhs (math 39% / reading 65%, grade C+, #103 of 512 statewide, top 21%, 667 students, 48% FRL); Indiana Area Shs (math 72% / reading 24%, grade D, #153 of 437 statewide, top 37%, 905 students, 40% FRL) — zoned schools average 48% FRL vs 32% district-wide (16 pts higher); higher-poverty schools than district average — tighter screening recommended.
- Market conditions: 94 active listings in the ZIP; 1 comparable units currently listed for rent nearby; 44 units permitted in Indiana County in 2024 (0 in 5+ unit buildings).
- Indiana County population projected at -18% by 2050 — secular population decline; favor cash flow + early exit over multi-decade hold.
Questions for listing agent
- What do current leases actually rent for vs. the listed asking? Can we see a recent rent roll and the last 12 months of T-12 income?
- Is there a deadline driving the sale (1031 exchange, divorce, estate, relocation)? That informs how much negotiation room exists.
- The area grade is low — what's the realistic commute time and amenity access for the typical tenant pool here? Any planned neighborhood developments (good or bad) we should know about?
- What's the average days-on-market for RENTAL listings here right now (not sales)? A rising rental-DOM trend means longer vacancies and softer asking-rent achievability than the comps imply.
- What's the recent tenant-quality profile in this submarket — average credit score on applications, eviction rate, late-payment / NSF rate, and stable-employment percentage? A property-management company in the area should have these aggregated.
- How much new for-sale + rental construction is in the pipeline within 1–3 miles? Heavy new supply typically softens prices + rents 12–24 months out; constrained supply supports both.
CashFlowRE · CFR-KZ2ZFTF33QGFE0
· Data 13 h ago
cashflowre.app · 2026-05-29