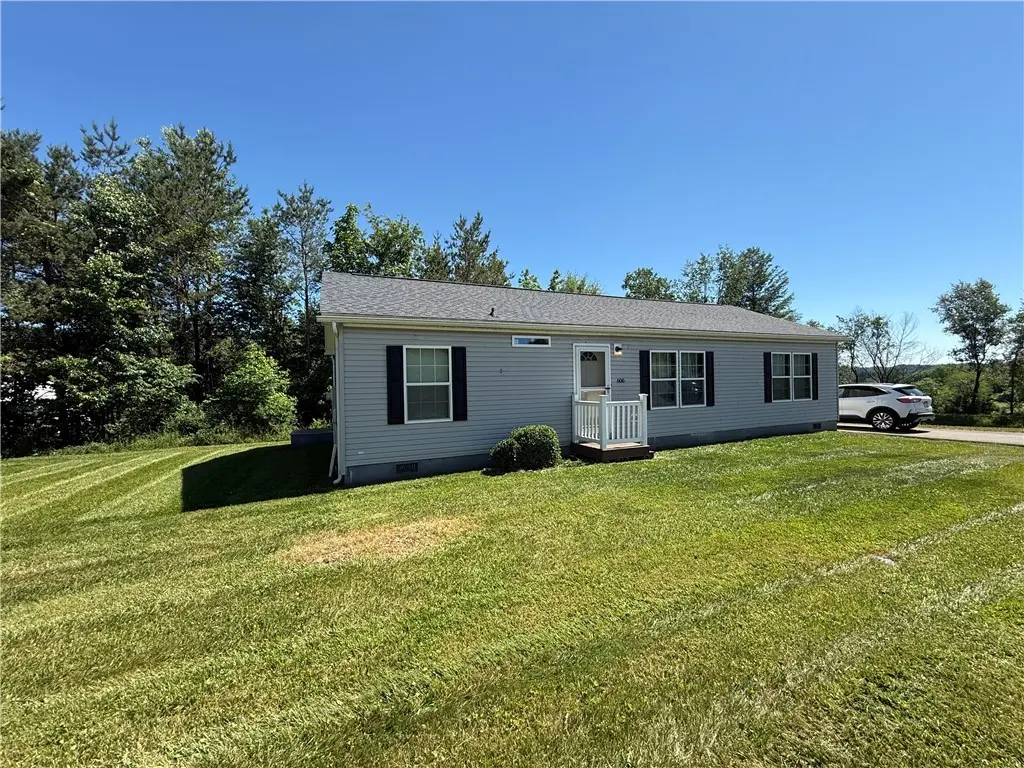
606 Ashley Dr · Indiana, PA
Flood risk No data
- FEMA flood zone
- —
- Chance of flooding over 30 yrs
- —
- Est. flood insurance / yr
- —
Fire risk No data
- Est. fire insurance / yr
- —
Heat risk No data
- Hot days now (above threshold)
- —
- Hot days in 30 yrs
- —
Wind risk No data
- Chance of severe wind over 30 yrs
- —
Air-quality risk No data
- Unhealthy air days now
- —
- Unhealthy air days in 30 yrs
- —
Risk factors via First Street. Map © Google.
Why this score? — see what drove the D grade
The composite is a weighted blend of 9 inputs, each scored 0–100. Each bar is that input's sub-score; the figure is the points it added to the 100-point composite (weight × sub-score).
- Cash flow +12.4/30.0
- ARV discount +7.5/15.0
- Schools +4.8/10.0
- Livability +3.8/5.0
- DSCR +3.7/10.0
- 1% rule +3.2/10.0
- Rent growth +2.5/5.0
- Condition / age +2.5/5.0
- Appreciation +0.0/10.0
$149,000
🖨 Deal sheet (PDF) 📄 Offer letter ✓ Due diligence
Listing remarks
For Sale – Charming 3-Bedroom Ranch Home in Las Casitas. Discover comfortable one-floor living in this well-maintained, cozy ranch home located in the desirable Las Casitas Development. Built in 2019, this move-in-ready property features 3 bedrooms and 2 full bathrooms, offering modern convenience and functional living space. Ideally situated just minutes from shopping centers, the YMCA, parks, a local hospital, Indiana University of Pennsylvania, and major highway access, this home combines a peaceful neighborhood setting with easy access to everyday amenities. Best of all, there are no HOA fees or association dues. Don't miss the opportunity to make this beautiful home yours. Call t
Key facts
- Easy access
- Move-in-ready
- One-floor living
Tags
Property features AI
Exterior
- Parking: Off-street parking for 2 vehicles
- Utilities: Public water; Public sewer; Electric service (standard)
- Home design: Single-story home; Vinyl siding; Asphalt roof; Resale condition
- Construction: Vinyl siding construction; Asphalt roof
- Exterior features: 0.2-acre lot
Interior
- Kitchen: Main-level kitchen (27 x 13)
- Bedrooms: Two main-level bedrooms (each about 13 x 10); Additional main-level room (16 x 13) that can serve as a bedroom or flexible living space
- Flooring: Carpet; Laminate
- Bathrooms: Two full bathrooms
- Heating & cooling: Forced air gas heating; Central air conditioning
- Interior features: Carpet and laminate flooring
- Laundry & utility: Main-level laundry (13 x 6)
Neighborhood map
What this means for you Summary
Snapshot
- This is a 3-bed/2.0-bath manufactured listed at $149k.
Deal economics
- At list price, monthly cash flow is $-24 ($-291/yr) — negative.
- To cash-flow at today's rent, offer at most $145k (2.9% below list).
- To meet the 1% rule (rent ≥ 1% of price), the offer needs to be $122k (17.8% below list).
- Recommended offer: $122k (17.8% below list) — sets the bar for 1% rule.
- Cap rate 6.1% vs local median 3.5% in Indiana — top-decile yield for the area; either an underpriced asset or a hidden risk that comps aren't pricing in. Stress-test before assuming the spread holds.
Location & tenants
- Location reads 75/100 on livability (#429 in PA, #3,920 nationally) — a middle-class / working-renter tenant base. Strengths: crime A+, cost of living A+, health & safety A+; Watch: amenities F, commute F, employment F.
- Indiana Area SD (town): math 49% / reading 67% proficiency, ranked #96 of 539 in PA (top 18%) — acceptable for families but not a draw, mixed tenant base, ~2y average lease.
- Zoned schools: Ben Franklin El Sch (math 47% / reading 62%, grade C, #504 of 1,518 statewide, top 37%, 393 students, 56% FRL); Indiana Area Jhs (math 39% / reading 65%, grade C+, #103 of 512 statewide, top 21%, 667 students, 48% FRL); Indiana Area Shs (math 72% / reading 24%, grade D, #153 of 437 statewide, top 37%, 905 students, 40% FRL) — zoned schools average 48% FRL vs 32% district-wide (16 pts higher); higher-poverty schools than district average — tighter screening recommended.
- Market conditions: 94 active listings in the ZIP; 1 comparable units currently listed for rent nearby; 44 units permitted in Indiana County in 2024 (0 in 5+ unit buildings).
Forward outlook
- Local home prices are declining (-3.0%/yr); year-one equity from $1k of loan paydown is wiped out by about $4k of value loss. Plan a longer hold.
- Indiana County population projected at -18% by 2050 — secular population decline; favor cash flow + early exit over multi-decade hold.
Negotiation context
- Only 4 days on market — expect competitive offers; lowballing is unlikely to land.
Questions for the listing agent
- What do current leases actually rent for vs. the listed asking? Can we see a recent rent roll and the last 12 months of T-12 income?
- Is there a deadline driving the sale (1031 exchange, divorce, estate, relocation)? That informs how much negotiation room exists.
- Schools are A-rated — typically a magnet for longer-tenancy family renters. What's the average tenant stay here, and is there a school-zone premium baked into asking?
- The area grade is low — what's the realistic commute time and amenity access for the typical tenant pool here? Any planned neighborhood developments (good or bad) we should know about?
- What's the average days-on-market for RENTAL listings here right now (not sales)? A rising rental-DOM trend means longer vacancies and softer asking-rent achievability than the comps imply.
- What's the recent tenant-quality profile in this submarket — average credit score on applications, eviction rate, late-payment / NSF rate, and stable-employment percentage? A property-management company in the area should have these aggregated.
- How much new for-sale + rental construction is in the pipeline within 1–3 miles? Heavy new supply typically softens prices + rents 12–24 months out; constrained supply supports both.
Investment metrics
- 1% rule
- 0.82% ✗
- Cap rate
- 6.10%
- Cash-on-cash
- -0.70%
- DSCR
- 0.97
- GRM
- 10.1
CMA / ARV
- ARV (on-the-fly)
- $57,200
- Comps found
- 2
Show comp detail 2 sales within ~0.75 mi
| Address | Dist | Beds/Ba | Sqft | Sold | Price | $/sf | Match |
|---|---|---|---|---|---|---|---|
| 114 Elmington Dr | 0.23mi | 3/2.0 | 1,328 (+2%) | 14mo | $30,000 | $23 | 74 |
| 454 Hammersmith Dr | 0.14mi | 3/2.0 | 1,404 (+8%) | 8mo | $62,000 | $44 | 73 |
Match score weights: distance 35% · size 25% · config 20% · recency 20%. Top-matched comps best support the ARV.
Projected returns pro-forma
-3.0% appreciation · 3.0% rent growth · sell at horizon
- IRR
- -17.5%
- Equity multiple
- 0.38×
- Total profit
- $-25,691
- Equity at exit
- $22,216
- IRR
- -9.5%
- Equity multiple
- 0.42×
- Total profit
- $-24,378
- Equity at exit
- $12,883
Cash invested: $41,720 (down + closing). Projections, not guarantees.
Landlord ↔ Tenant lean methodology
- Overall (STATE)
- 62 Landlord-Friendly
- State Pennsylvania
- 62 Landlord-Friendly · EVEN
- County
- — inherits STATE
- City
- — inherits STATE
ZIP-level market 15701
- Home prices YoY
- -26.2%
- Active inventory
- 94
- Price-to-rent
- 10.1×
Monthly cashflow live
- Estimated rent
- $1,224 medium interval (Pro) →
- Mortgage (P&I)
- −$781
- Tax from tax record
- −$148 /mo · $1,774/yr
- Insurance
- −$62
- HOA
- −$0
- Vacancy / Maint / Mgmt
- −$257
- Net cashflow
- $-24
Break-even live
Sensitivity live
| Price | -10% $60 | -5% $18 | +0% $-24 | +5% $-66 | +10% $-109 |
|---|---|---|---|---|---|
| Rent | -10% $-121 | -5% $-73 | +0% $-24 | +5% $24 | +10% $73 |
| Rate | -1.0pp $51 | -0.5pp $14 | base $-24 | +0.5pp $-63 | +1.0pp $-102 |
UW: 25.0% down · 7.5% · 30yr · 1.5% tax · 5.0% vac · 8.0% maint · 8.0% mgmt
Financing live
Cash to close
- Down payment
- $37,250
- Closing costs
- $4,470
- Reserves months
- —
- Total cash needed
- —
Loan-product check · same deal, 3 products live
Conventional
25% down · 7.5% · 30yr
- Down + closing
- —
- Monthly P&I
- —
- Monthly cashflow
- —
- DSCR
- —
- Eligible?
- —
Personal DTI + credit; lowest rate.
DSCR
20% down · 8.5% · 30yr
- Down + closing
- —
- Monthly P&I
- —
- Monthly cashflow
- —
- DSCR
- —
- Eligible?
- —
No personal income docs; deal must DSCR.
Hard money
10% down · 12.0% · 12mo
- Down + closing
- —
- Monthly P&I
- —
- Monthly cashflow
- —
- DSCR
- —
- Eligible?
- —
Short-term bridge; refi at stabilization.
Rent comps 1 comps
| Address | Beds | Baths | Sqft | Rent | $/sqft | DOM | Units | Dist |
|---|---|---|---|---|---|---|---|---|
| 1895 Warren Rd Indiana, PA | 1.0–2.0 | 1.0–1.5 | 790 | $995 | $1.26 | 45d | 6 | 1.47mi |
Listing history 4 events
-
2026-06-22status $149,000 Active 4 DOM
-
2026-06-12statusdays on market $149,000 Pending 4 DOM
-
2026-06-09remarks 693-char remark
-
2026-06-09$149,000 Active 1 DOM
ⓘ Source: listings_history table (triggers on properties + properties_extension) + one-shot
backfill from property_details.listing_events for pre-trigger history.
Tax reassessment forecast PA · Partial reset (capped growth)
- Current annual tax
- $1,774 · $148/mo
- Projected year-2 tax
- $2,064 · $172/mo
- Expected delta
- +$290/yr (+$24/mo · 16.3%)
ⓘ Screening estimate from a state-policy table — verify with the county assessor before closing.
Nearby sold comps map
Loading sold comps map…
Walkable amenities ~0.75 mi
Loading nearby amenities…
Taxation est. · year 1
- Rental income
- $14,690
- − Mortgage interest
- −$8,346
- − Property taxes
- −$1,774
- − Insurance
- −$745
- − Repairs & maintenance
- −$1,175
- − Management
- −$1,175
- − Depreciation
- −$4,335
- Taxable loss
- −$2,860
- Est. tax savings @ 24.0%
- +$686
- After-tax cash flow
- $396/yr
For passive investors: Depreciation is non-cash, so a rental often shows a tax loss while cash-flowing — sheltering income. Rental losses are passive: they offset passive income freely, and up to $25,000/yr can offset ordinary (W-2) income if you actively participate and your MAGI is under $100k (phasing out to $0 by $150k); unused losses carry forward. On sale, claimed depreciation is recaptured at up to 25%, and gains may owe capital-gains tax (a 1031 exchange can defer both). Figures are a year-1 estimate at your 24.0% rate — not tax advice; consult a CPA.
Schools (NCES district)
- District
- Indiana Area SD
- NCES district ID
- 4212150
- Math proficiency
- 49% ▼ -9.00%
- Reading proficiency
- 67% ▼ -8.00%
- Median HH income
- $40,558
- Composite
- 48.44/100
- National rank
- #2133
- State rank
- #96 of 539 in PA
Livability — Indiana
- Score
- 75/100
- State rank
- #429
- US rank
- #3920
Category grades
Schools grade is shown separately in the Schools card above.
Census & demographics
- County
- Indiana County · 31,269 people
- City population
- 31,269
- Metro
- Indiana, PA
- Population (ZIP)
- 31,269
- Household income
- $56,311
- Rent vs Own
- Severe rent burden
- 1590.0
Population outlook (Indiana County) Hauer SSP2
- Today (2025)
- 84,294 people
- By 2030
- 81,773 · -3.0%
- By 2040
- 75,213 · -10.8%
- By 2050
- 69,348 · -17.7%
- By 2075
- 57,951 · -31.3%
- By 2100
- 47,313 · -43.9%
Race, ethnicity, and origin ACS 2023
- Neighborhood character
- Predominantly White (89%)
- Race & ethnicity
- White 89% Black 4% Two or more races 3% Hispanic / Latino 2% Asian 2%
- Common ancestry
- Romanian 7% Serbian 3% Italian 2%
- Foreign-born
- 4% · Canada
- Languages at home
- 94% English-only · Other Indo-European 2% Arabic 1% French/Haitian/Cajun 1%
Political lean MEDSL · Indiana
- 2024 margin
- Solid R (+39.1) · D 30.1% · R 69.2%
- 2008→2024 swing
- -32.0pp toward R · 2008: -7.1pp · 2024: -39.1pp
- All cycles
- 2024: R+39.1 2020: R+37.5 2016: R+35.6 2012: R+18.8 2008: R+7.1
Not yet ingested
- Civics
- —
Market trends
- HPI YoY
- ▼ -59.33%
- Current HPI
- 167.0982
- Rent YoY
- —
- Metro
- Indiana, PA
- State GDP YoY
- ▲ 1.68%
- F500 in state
- 34
Industry mix (Fortune 500 HQ in PA)
| Industry | F500 HQs | Revenue |
|---|---|---|
| Healthcare | 2 | $309B |
|
||
| Insurance | 2 | $27B |
|
||
| Telecommunications / Media | 1 | $124B |
|
||
| Industrial Distribution | 1 | $22B |
|
||
| Financial Services | 1 | $20B |
|
||
| Chemicals / Materials | 1 | $18B |
|
||
Price history
1 event — show timeline
- 2026-06-08 Listed $149,000 West Penn MLS
Property tax history
+2.7%/yrLatest (2026): $1,774 · +2.2% YoY. Source: county tax records.
Cash-flow waterfall
monthlySold comps — $/sqft
last 12 mo · ≤1 miLoading sold comps…