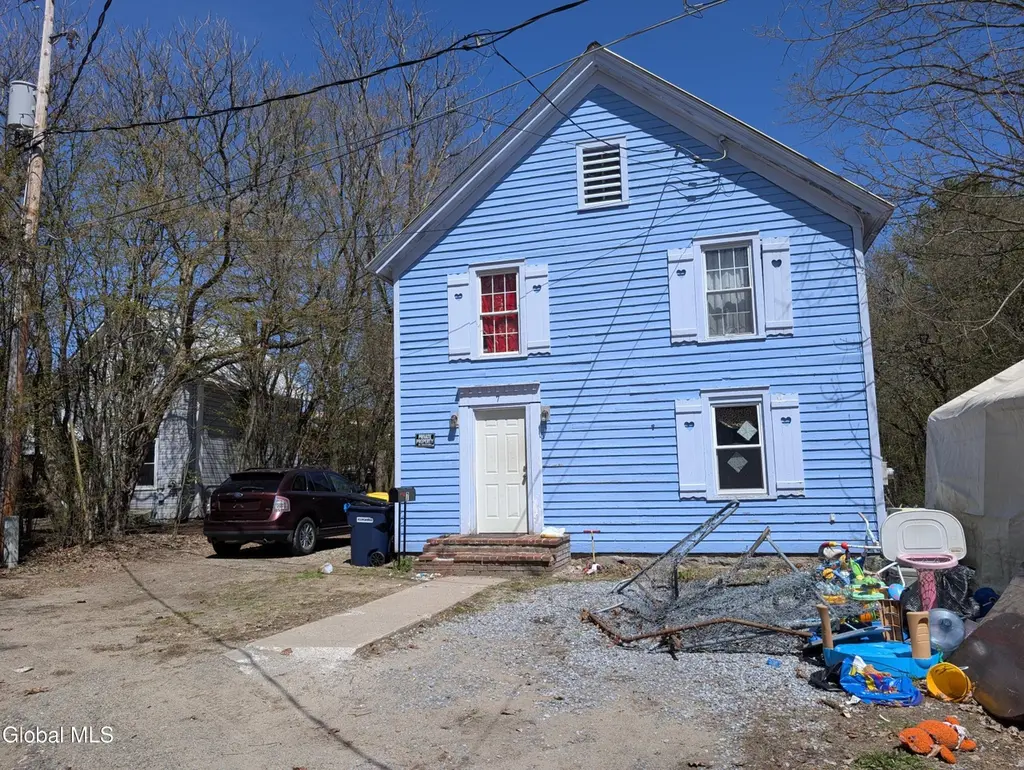
7 Prosser Cir
Warrensburg, NY 12885
$65,000B+
3 bd · 1.0 ba ·
1,248 sqft ·
Built 1900
· SingleFamily
· Pending
· 9 DOM
Cashflow @ list (25.0% down · 7.5%)
Estimated rent
$1,344/mo
Mortgage (P&I)
−$341
Tax + insurance
−$217
HOA
−$0
Vac / Maint / Mgmt
−$282
Net cashflow
$504/mo
Annual
$6,046/yr
Cap rate
15.59%
Cash-on-cash
33.22%
DSCR
2.48
1% rule
2.07%
Cash to close
$18,200
Investor read
- This is a 3-bed/1.0-bath single-family listed at $65k.
- At list price, monthly cash flow is $504 ($6k/yr) — positive.
- The deal already cash-flows at list — no discount required.
- Meets the 1% rule at list price ($1k rent vs $65k).
- Only 9 days on market — expect competitive offers; lowballing is unlikely to land.
- In year one you build about $7k of equity ($449 loan paydown + $6k appreciation (10.0% local appreciation)).
- Location reads 63/100 on livability (#823 in NY) — a middle-class / working-renter tenant base. Strengths: housing A+, cost of living B+, crime B; Watch: amenities F, commute F, health & safety D-.
- Warrensburg Central School District (town): math 47% / reading 44% proficiency, ranked #552 of 755 in NY (top 73%) — families likely to look elsewhere, expect single-tenant / working-renter base with shorter leases.
- Zoned schools: Warrensburg Elementary School (math 37% / reading 52%, grade F, #1,277 of 2,108 statewide, top 64%, 361 students, 58% FRL); Warrensburg Junior-Senior High School (math 62% / reading 57%, grade C+, #851 of 1,100 statewide, top 80%, 302 students, 64% FRL) — zoned schools average 61% FRL vs 39% district-wide (21 pts higher); higher-poverty schools than district average — tighter screening recommended.
- Watch-outs: property tax is 3.5% of price; built in 1900 — expect roof / HVAC / electrical / plumbing capex.
- Market conditions: 49 active listings in the ZIP; 180 units permitted in Warren County in 2024 (40 in 5+ unit buildings).
- Warren County population projected at -19% by 2050 — secular population decline; favor cash flow + early exit over multi-decade hold.
- At projected returns (10.0% appreciation + 3.0% rent growth), your $18k cash investment doubles in ~2 years — after that, you're playing with house money.
- By year 5, paydown + projected appreciation supports a ~$32k cash-out refi (75% LTV) — recoverable capital for the next deal without selling this one.
- Cap rate 15.6% vs local median 2.6% in Warrensburg — top-decile yield for the area; either an underpriced asset or a hidden risk that comps aren't pricing in. Stress-test before assuming the spread holds.
Questions for listing agent
- Built in 1900 — when were the roof, HVAC, electrical panel, plumbing, and water heater last replaced?
- Property tax is high relative to price — has the assessment been appealed recently, and will the sale trigger a re-assessment?
- Is there a deadline driving the sale (1031 exchange, divorce, estate, relocation)? That informs how much negotiation room exists.
- Schools are D-rated, which usually means shorter tenancies and higher turnover. Who's the typical renter profile here, and what's been the actual vacancy rate?
- What's the average days-on-market for RENTAL listings here right now (not sales)? A rising rental-DOM trend means longer vacancies and softer asking-rent achievability than the comps imply.
- What's the recent tenant-quality profile in this submarket — average credit score on applications, eviction rate, late-payment / NSF rate, and stable-employment percentage? A property-management company in the area should have these aggregated.
- How much new for-sale + rental construction is in the pipeline within 1–3 miles? Heavy new supply typically softens prices + rents 12–24 months out; constrained supply supports both.
CashFlowRE · CFR-KZK5W72BTFVCS8
· Data 3 weeks ago
cashflowre.app · 2026-05-29