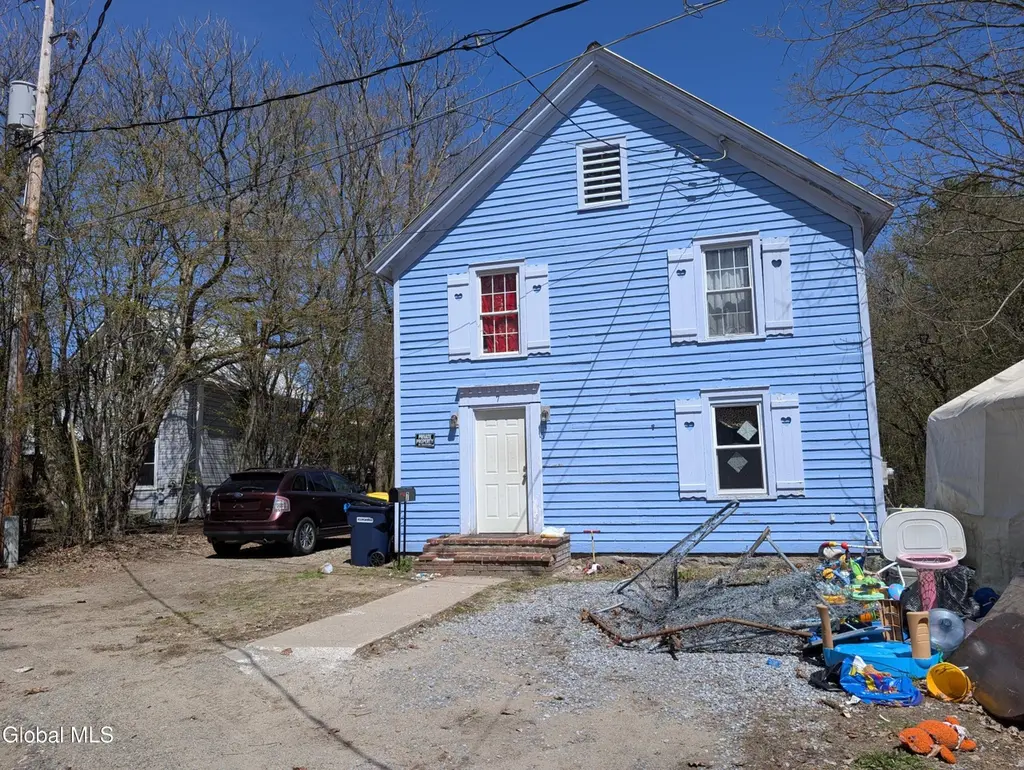
7 Prosser Cir · Warrensburg, NY
Flood risk 1/10 · Minimal
- FEMA flood zone
- X
- Chance of flooding over 30 yrs
- 0.0%
- Est. flood insurance / yr
- $473 – $860
Fire risk 4/10 · Minor
- Est. fire insurance / yr
- $691 – $1,283
Heat risk 2/10 · Minimal
- Hot days now (above 91°F)
- 7 days/yr
- Hot days in 30 yrs
- 16 days/yr
Wind risk 2/10 · Minimal
- Chance of severe wind over 30 yrs
- 2.0%
Air-quality risk 1/10 · Minimal
- Unhealthy air days now
- 0 days/yr
- Unhealthy air days in 30 yrs
- 0 days/yr
Risk factors via First Street. Map © Google.
Why this score? — see what drove the B+ grade
The composite is a weighted blend of 9 inputs, each scored 0–100. Each bar is that input's sub-score; the figure is the points it added to the 100-point composite (weight × sub-score).
- Cash flow +30.0/30.0
- 1% rule +10.0/10.0
- DSCR +10.0/10.0
- Appreciation +10.0/10.0
- ARV discount +7.5/15.0
- Schools +4.1/10.0
- Livability +3.2/5.0
- Rent growth +2.5/5.0
- Condition / age +2.5/5.0
$65,000
🖨 Deal sheet 📄 Offer letter ✓ Due diligence
Listing remarks
3 bedroom, 1 bathroom home located at 7 Prosser Circle in Warrensburg. Set on a quiet street with a decent size backyard, this property offers a solid starting point for someone ready to make it their own. The home is currently livable and provides a functional layout, with room to update and improve over time. Some cosmetic work and cleanout will go a long way here, giving the next owner the chance to build equity without starting from scratch. Major items have already been addressed, including a metal roof and a newer water heater, helping to take care of some of the bigger concerns upfront. Whether you are looking for a primary residence or a project you can move into right away, this pr
Key facts
- 9,583 sq ft lot
- 3 parking spots
- Built 1900
Property features AI
Exterior
- Parking: Driveway with space for 3 vehicles
- Utilities: Public water; Septic tank
- Home design: Single family residence; Property listed as fixer
- Construction: Wood siding; Stone foundation
- Exterior features: Metal roof
Interior
- Kitchen: Range
- Bedrooms: Three bedrooms located on the second floor
- Flooring: Tile; Wood; Laminate
- Bathrooms: One full bathroom on the second floor
- Heating & cooling: Forced air heating
- Interior features: Total of 6 rooms; Full, unfinished basement
Neighborhood map
What this means for you Summary
Snapshot
- This is a 3-bed/1.0-bath single-family listed at $65k.
Deal economics
- At list price, monthly cash flow is $504 ($6k/yr) — positive.
- The deal already cash-flows at list — no discount required.
- Meets the 1% rule at list price ($1k rent vs $65k).
- Cap rate 15.6% vs local median 2.6% in Warrensburg — top-decile yield for the area; either an underpriced asset or a hidden risk that comps aren't pricing in. Stress-test before assuming the spread holds.
Location & tenants
- Location reads 63/100 on livability (#823 in NY) — a middle-class / working-renter tenant base. Strengths: housing A+, cost of living B+, crime B; Watch: amenities F, commute F, health & safety D-.
- Warrensburg Central School District (town): math 47% / reading 44% proficiency, ranked #552 of 755 in NY (top 73%) — families likely to look elsewhere, expect single-tenant / working-renter base with shorter leases.
- Zoned schools: Warrensburg Elementary School (math 37% / reading 52%, grade F, #1,277 of 2,108 statewide, top 64%, 361 students, 58% FRL); Warrensburg Junior-Senior High School (math 62% / reading 57%, grade C+, #851 of 1,100 statewide, top 80%, 302 students, 64% FRL) — zoned schools average 61% FRL vs 39% district-wide (21 pts higher); higher-poverty schools than district average — tighter screening recommended.
- Market conditions: 49 active listings in the ZIP; 180 units permitted in Warren County in 2024 (40 in 5+ unit buildings).
Forward outlook
- In year one you build about $7k of equity ($449 loan paydown + $6k appreciation (10.0% local appreciation)).
- Warren County population projected at -19% by 2050 — secular population decline; favor cash flow + early exit over multi-decade hold.
- At projected returns (10.0% appreciation + 3.0% rent growth), your $18k cash investment doubles in ~2 years — after that, you're playing with house money.
- By year 5, paydown + projected appreciation supports a ~$32k cash-out refi (75% LTV) — recoverable capital for the next deal without selling this one.
Negotiation context
- Only 9 days on market — expect competitive offers; lowballing is unlikely to land.
Risks & watch-outs
- Watch-outs: property tax is 3.5% of price; built in 1900 — expect roof / HVAC / electrical / plumbing capex.
Questions for the listing agent
- Built in 1900 — when were the roof, HVAC, electrical panel, plumbing, and water heater last replaced?
- Property tax is high relative to price — has the assessment been appealed recently, and will the sale trigger a re-assessment?
- Is there a deadline driving the sale (1031 exchange, divorce, estate, relocation)? That informs how much negotiation room exists.
- Schools are D-rated, which usually means shorter tenancies and higher turnover. Who's the typical renter profile here, and what's been the actual vacancy rate?
- What's the average days-on-market for RENTAL listings here right now (not sales)? A rising rental-DOM trend means longer vacancies and softer asking-rent achievability than the comps imply.
- What's the recent tenant-quality profile in this submarket — average credit score on applications, eviction rate, late-payment / NSF rate, and stable-employment percentage? A property-management company in the area should have these aggregated.
- How much new for-sale + rental construction is in the pipeline within 1–3 miles? Heavy new supply typically softens prices + rents 12–24 months out; constrained supply supports both.
Investment metrics
- 1% rule
- 2.07% ✓
- Cap rate
- 15.59%
- Cash-on-cash
- 33.22%
- DSCR
- 2.48
- GRM
- 4.0
CMA / ARV
- ARV (median comp)
- $256,975
- List price
- $65,000
- Delta
- -74.71%
- Verdict
- UNDERPRICED
- Comps
- 20 within 1.0 mi
Show comp detail 6 sales within ~0.75 mi
| Address | Dist | Beds/Ba | Sqft | Sold | Price | $/sf | Match |
|---|---|---|---|---|---|---|---|
| 13 Warren St | 0.53mi | 3/1.0 | 1,215 (-3%) | 7mo | $157,700 | $130 | 65 |
| 11 Sunset Ave | 0.42mi | 2/1.0 (-1) | 1,224 (-2%) | 13mo | $285,000 | $233 | 62 |
| 17 Elm St | 0.38mi | 3/1.0 | 1,344 (+8%) | 14mo | $255,000 | $190 | 58 |
| 23 Mountain Ave | 0.59mi | 3/1.0 | 1,260 (+1%) | 22mo | $100,000 | $79 | 53 |
| 5 Ridge Ave | 0.37mi | 3/2.0 | 1,118 (-10%) | 17mo | $185,000 | $165 | 47 |
| 43 Oak St | 0.74mi | 3/1.0 | 1,080 (-14%) | 7mo | $161,556 | $150 | 37 |
Match score weights: distance 35% · size 25% · config 20% · recency 20%. Top-matched comps best support the ARV.
Projected returns pro-forma
10.0% appreciation · 3.0% rent growth · sell at horizon
- IRR
- 49.7%
- Equity multiple
- 4.71×
- Total profit
- $67,577
- Equity at exit
- $58,557
- IRR
- 43.5%
- Equity multiple
- 10.56×
- Total profit
- $173,942
- Equity at exit
- $126,281
Cash invested: $18,200 (down + closing). Projections, not guarantees.
Landlord ↔ Tenant lean methodology
- Overall (STATE)
- 15 Strongly Tenant-Friendly
- State New York
- 15 Strongly Tenant-Friendly · D+10
- County
- — inherits STATE
- City
- — inherits STATE
ZIP-level market 12885
- Home prices YoY
- 19.6%
- Active inventory
- 49
- Price-to-rent
- 4.0×
Monthly cashflow live
- Estimated rent
- $1,344 medium interval (Pro) →
- Mortgage (P&I)
- −$341
- Tax from tax record
- −$190 /mo · $2,276/yr
- Insurance
- −$27
- HOA
- −$0
- Vacancy / Maint / Mgmt
- −$282
- Net cashflow
- $504
Break-even live
UW: 25.0% down · 7.5% · 30yr · 1.5% tax · 5.0% vac · 8.0% maint · 8.0% mgmt
Financing live
Cash to close
- Down payment
- $16,250
- Closing costs
- $1,950
- Reserves months
- —
- Total cash needed
- —
Loan-product check · same deal, 3 products live
Conventional
25% down · 7.5% · 30yr
- Down + closing
- —
- Monthly P&I
- —
- Monthly cashflow
- —
- DSCR
- —
- Eligible?
- —
Personal DTI + credit; lowest rate.
DSCR
20% down · 8.5% · 30yr
- Down + closing
- —
- Monthly P&I
- —
- Monthly cashflow
- —
- DSCR
- —
- Eligible?
- —
No personal income docs; deal must DSCR.
Hard money
10% down · 12.0% · 12mo
- Down + closing
- —
- Monthly P&I
- —
- Monthly cashflow
- —
- DSCR
- —
- Eligible?
- —
Short-term bridge; refi at stabilization.
Listing history 4 events
-
2026-05-14status Pending 770-char remark
-
2026-05-04$65,000 Active 770-char remark
-
1996-12-06soldstatus $62,000
-
1994-08-04soldstatus $13,000
ⓘ Source: listings_history table (triggers on properties + properties_extension) + one-shot
backfill from property_details.listing_events for pre-trigger history.
Tax reassessment forecast NY · Partial reset (capped growth)
- Current annual tax
- $2,276 · $190/mo
- Projected year-2 tax
- $2,276 · $190/mo
- Expected delta
- $0/yr ($0/mo · 0.0%)
ⓘ Screening estimate from a state-policy table — verify with the county assessor before closing.
Climate risk First Street
- Flood 1/10 Low FEMA zone X · 0% chance over 30 yrs
- Wildfire 4/10 Moderate
- Heat 2/10 Low 7 d/yr ≥91°F today · 16 d/yr by 30 yrs out
- Wind 2/10 Low 2% chance of damaging wind over 30 yrs
- Air quality 1/10 Low 0 unhealthy d/yr today · 0 by 30 yrs out
Nearby sold comps map
Loading sold comps map…
Walkable amenities ~0.75 mi
Loading nearby amenities…
Taxation est. · year 1
- Rental income
- $16,124
- − Mortgage interest
- −$3,641
- − Property taxes
- −$2,276
- − Insurance
- −$325
- − Repairs & maintenance
- −$1,290
- − Management
- −$1,290
- − Depreciation
- −$1,891
- Taxable income
- $5,411
- Est. tax owed @ 24.0%
- −$1,299
- After-tax cash flow
- $4,748/yr
For passive investors: Depreciation is non-cash, so a rental often shows a tax loss while cash-flowing — sheltering income. Rental losses are passive: they offset passive income freely, and up to $25,000/yr can offset ordinary (W-2) income if you actively participate and your MAGI is under $100k (phasing out to $0 by $150k); unused losses carry forward. On sale, claimed depreciation is recaptured at up to 25%, and gains may owe capital-gains tax (a 1031 exchange can defer both). Figures are a year-1 estimate at your 24.0% rate — not tax advice; consult a CPA.
Schools (NCES district)
- District
- Warrensburg Central School District
- NCES district ID
- 3629910
- Math proficiency
- 47% ▲ 4.00%
- Reading proficiency
- 44% ▼ -2.00%
- Median HH income
- $48,828
- Composite
- 41.15/100
- National rank
- #7424
- State rank
- #552 of 755 in NY
Livability — Warrensburg
- Score
- 63/100
- State rank
- #823
- US rank
- #15925
Category grades
Schools grade is shown separately in the Schools card above.
Census & demographics
- Census place
- Warrensburg, NY
- Population (ZIP)
- 4,531
Population outlook (Warren County) Hauer SSP2
- Today (2025)
- 62,372 people
- By 2030
- 60,491 · -3.0%
- By 2040
- 55,616 · -10.8%
- By 2050
- 50,437 · -19.1%
- By 2075
- 40,843 · -34.5%
- By 2100
- 31,159 · -50.0%
Race, ethnicity, and origin ACS 2023
- Neighborhood character
- Predominantly White (89%)
- Race & ethnicity
- White 89% Two or more races 5% Asian 3% Hispanic / Latino 3%
- Common ancestry
- Lithuanian 4% Portuguese 2% Slovak 2%
- Foreign-born
- 4% · Canada
- Languages at home
- 96% English-only · Other Indo-European 2% Tagalog/Filipino 1%
Political lean MEDSL · Warren
- 2024 margin
- Toss-up / Even · D 47.9% · R 52.1%
- 2008→2024 swing
- -6.9pp toward R · 2008: 2.6pp · 2024: -4.2pp
- All cycles
- 2024: R+4.2 2020: R+0.2 2016: R+10.6 2012: D+2.1 2008: D+2.6
Not yet ingested
- Civics
- —
Market trends
- HPI YoY
- ▲ 60.30%
- Current HPI
- 368.3803
- Rent YoY
- —
- Metro
- —
- State GDP YoY
- ▲ 2.60%
- F500 in state
- 92
Industry mix (Fortune 500 HQ in NY)
| Industry | F500 HQs | Revenue |
|---|---|---|
| Financial Services | 10 | $950B |
|
||
| Consumer Goods | 9 | $162B |
|
||
| Insurance | 4 | $225B |
|
||
| Telecommunications | 2 | $144B |
|
||
| Pharmaceuticals | 2 | $112B |
|
||
| Media / Entertainment | 2 | $69B |
|
||
Price history
+400.0% since first listed4 events — show timeline
- 2026-05-14 Pending — Global MLS
- 2026-05-04 Listed $65,000 Global MLS
- 1996-12-06 Sold (Public Records) $62,000 Public Records
- 1994-08-04 Sold (Public Records) $13,000 Public Records
Property tax history
+5.8%/yrLatest (2025): $2,276 · -0.5% YoY. Source: county tax records.
Cash-flow waterfall
monthlySold comps — $/sqft
last 12 mo · ≤1 miLoading sold comps…