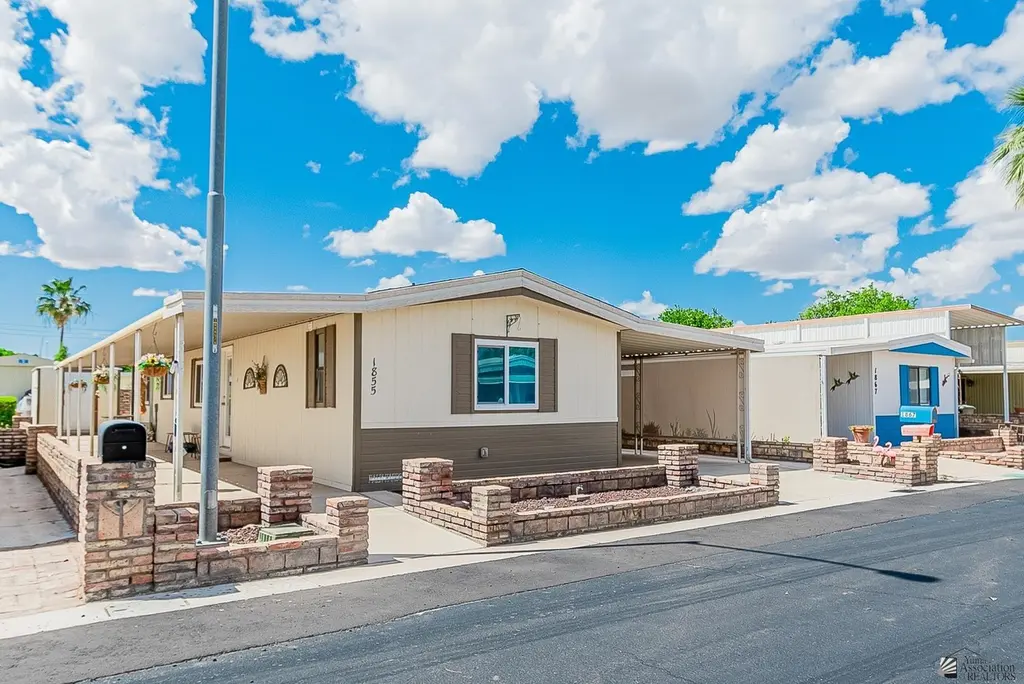
1855 W Camino Otero
Yuma, AZ 85364
$155,000F
2 bd · 2.0 ba ·
929 sqft ·
Built 1986
· Manufactured
· Active
· 39 DOM
Cashflow @ list (25.0% down · 7.5%)
Estimated rent
$1,168/mo
Mortgage (P&I)
−$813
Tax + insurance
−$135
HOA
−$43
Vac / Maint / Mgmt
−$245
Net cashflow
$-67/mo
Annual
$-810/yr
Cap rate
5.77%
Cash-on-cash
-1.87%
DSCR
0.92
1% rule
0.75%
Cash to close
$43,400
Investor read
- This is a 2-bed/2.0-bath manufactured listed at $155k.
- At list price, monthly cash flow is $-67 ($-810/yr) — negative.
- To cash-flow at today's rent, offer at most $143k (7.7% below list).
- To meet the 1% rule (rent ≥ 1% of price), the offer needs to be $117k (24.6% below list).
- It's been on market 39 days — a 3% lower offer ($150k) is reasonable based on typical stale-listing flexibility.
- Recommended offer: $117k (24.6% below list) — sets the bar for 1% rule.
- Local home prices are declining (-3.0%/yr); year-one equity from $1k of loan paydown is wiped out by about $5k of value loss. Plan a longer hold.
- Location reads 71/100 on livability (#30 in AZ) — a middle-class / working-renter tenant base. Strengths: cost of living A+, housing A+, health & safety A+; Watch: schools C-, crime C-, employment D.
- Crane Elementary District (4501) (urban): math 21% / reading 30% proficiency, ranked #134 of 249 in AZ (top 54%) — low school quality limits family demand, transient renter base, plan for 1-2y turnover; 62% free/reduced lunch — lower-income household profile, screen leases tightly.
- Market conditions: Rents rising (+2.0%/yr); 262 active listings in the ZIP; 25 comparable units currently listed for rent nearby; rentals leasing fast (median 14d on market — plan ~1-2 weeks tenant-placement turnaround); 1,399 units permitted in Yuma County in 2024 (180 in 5+ unit buildings).
- Yuma County population projected at +4% by 2050 — modest demand growth; plan on rents tracking national, not racing it.
- Current owner paid $62k; list at $155k implies a 150% gain — meaningful room to come down on a strong offer.
- Climate carrying-cost: extreme-heat days projected 7→20/yr by 2055 (HVAC capex compounding) — expect insurance premiums to compound above CPI over the hold.
- Cap rate 5.8% vs local median 3.9% in Yuma — top-decile yield for the area; either an underpriced asset or a hidden risk that comps aren't pricing in. Stress-test before assuming the spread holds.
Questions for listing agent
- What do current leases actually rent for vs. the listed asking? Can we see a recent rent roll and the last 12 months of T-12 income?
- It's been on market 39 days. Have you received any prior offers? Is the seller open to a 25% concession, seller financing, or rate buy-down credit?
- What does the HOA fee cover, when was the last increase, and are there any pending special assessments or reserve-fund shortfalls?
- Is there a deadline driving the sale (1031 exchange, divorce, estate, relocation)? That informs how much negotiation room exists.
- The area grade is low — what's the realistic commute time and amenity access for the typical tenant pool here? Any planned neighborhood developments (good or bad) we should know about?
- What's the average days-on-market for RENTAL listings here right now (not sales)? A rising rental-DOM trend means longer vacancies and softer asking-rent achievability than the comps imply.
- What's the recent tenant-quality profile in this submarket — average credit score on applications, eviction rate, late-payment / NSF rate, and stable-employment percentage? A property-management company in the area should have these aggregated.
- How much new for-sale + rental construction is in the pipeline within 1–3 miles? Heavy new supply typically softens prices + rents 12–24 months out; constrained supply supports both.
CashFlowRE · CFR-M0FWZQDM3G56P1
· Data 1 day ago
cashflowre.app · 2026-05-29