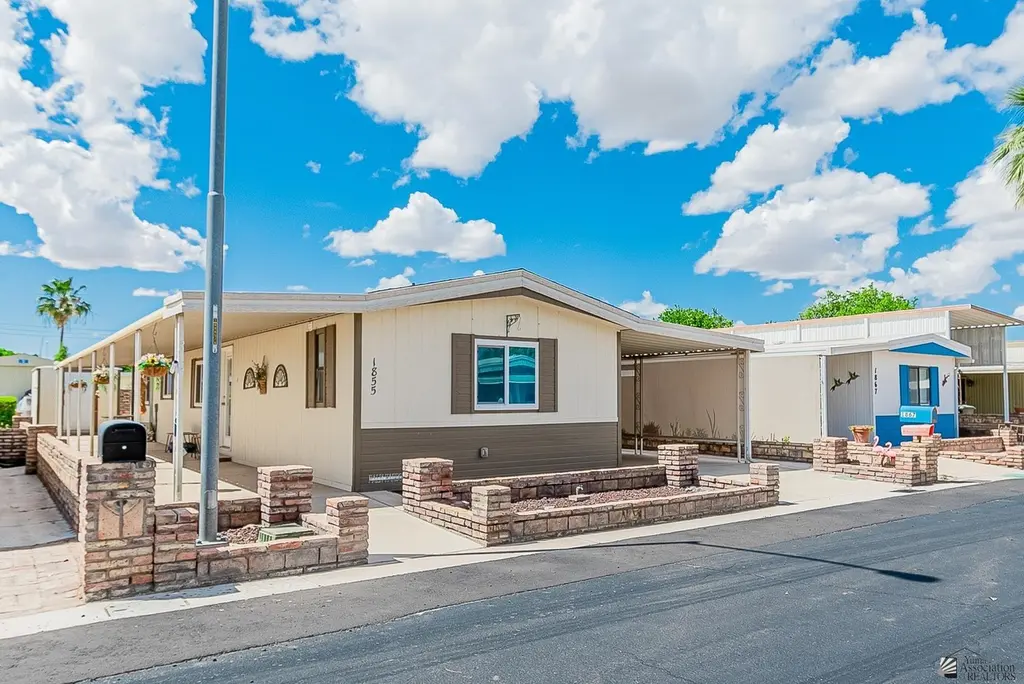
1855 W Camino Otero · Yuma, AZ
Flood risk 1/10 · Minimal
- FEMA flood zone
- X (shaded)
- Chance of flooding over 30 yrs
- 0.0%
- Est. flood insurance / yr
- $507 – $1,088
Fire risk 1/10 · Minimal
- Est. fire insurance / yr
- $610 – $1,132
Heat risk 9/10 · Severe
- Hot days now (above 113°F)
- 7 days/yr
- Hot days in 30 yrs
- 20 days/yr
Wind risk 1/10 · Minimal
- Chance of severe wind over 30 yrs
- —
Air-quality risk 2/10 · Minimal
- Unhealthy air days now
- 2 days/yr
- Unhealthy air days in 30 yrs
- 2 days/yr
Risk factors via First Street. Map © Google.
Why this score? — see what drove the F grade
The composite is a weighted blend of 9 inputs, each scored 0–100. Each bar is that input's sub-score; the figure is the points it added to the 100-point composite (weight × sub-score).
- Cash flow +10.9/30.0
- Livability +3.6/5.0
- DSCR +3.2/10.0
- Rent growth +3.0/5.0
- 1% rule +2.5/10.0
- Condition / age +2.5/5.0
- Schools +2.2/10.0
- ARV discount +0.0/15.0
- Appreciation +0.0/10.0
$155,000
🖨 Deal sheet 📄 Offer letter ✓ Due diligence
Listing remarks
If you’ve been searching for an updated, affordable home in Yuma with community amenities, low HOA fees, and space to relax and entertain, this one is worth a look! Welcome to Casa Mañana, a popular 55+ community in the heart of Yuma with a low annual HOA of just $524/year. Own the land and home in this fun and well-maintained neighborhood! SPACIOUS This partially furnished, move-in ready 2 bedroom, 2 bathroom home offers comfortable living with extra flexibility thanks to the large Arizona room — perfect for a guest space, hobby room, office, or second living area- as well as the covered carport that gives you plenty of room for parking and visitors. UPDATED This home of
Key facts
- Low hoa fees
- Covered carport
- Updated flooring
Tags
Property features AI
Finance
- Financial info: Annual property tax approximately $806.64
- HOA & community: Homeowners association with a monthly fee of $43.67
Exterior
- Parking: 2 total parking spaces; 2 covered parking spaces; 2-car carport
- Home design: Manufactured home (mobile home)
- Exterior features: Located in the Casa Manana subdivision; Senior community
Interior
- Bathrooms: 2 full bathrooms
- Interior features: Private pool
Neighborhood map
What this means for you Summary
Snapshot
- This is a 2-bed/2.0-bath manufactured listed at $155k.
Deal economics
- At list price, monthly cash flow is $-67 ($-810/yr) — negative.
- To cash-flow at today's rent, offer at most $143k (7.7% below list).
- To meet the 1% rule (rent ≥ 1% of price), the offer needs to be $117k (24.6% below list).
- Recommended offer: $117k (24.6% below list) — sets the bar for 1% rule.
- Cap rate 5.8% vs local median 3.9% in Yuma — top-decile yield for the area; either an underpriced asset or a hidden risk that comps aren't pricing in. Stress-test before assuming the spread holds.
Location & tenants
- Location reads 71/100 on livability (#30 in AZ) — a middle-class / working-renter tenant base. Strengths: cost of living A+, housing A+, health & safety A+; Watch: schools C-, crime C-, employment D.
- Crane Elementary District (4501) (urban): math 21% / reading 30% proficiency, ranked #134 of 249 in AZ (top 54%) — low school quality limits family demand, transient renter base, plan for 1-2y turnover; 62% free/reduced lunch — lower-income household profile, screen leases tightly.
- Market conditions: Rents rising (+2.0%/yr); 262 active listings in the ZIP; 25 comparable units currently listed for rent nearby; rentals leasing fast (median 13d on market — plan ~1-2 weeks tenant-placement turnaround); 1,399 units permitted in Yuma County in 2024 (180 in 5+ unit buildings).
Forward outlook
- Local home prices are declining (-3.0%/yr); year-one equity from $1k of loan paydown is wiped out by about $5k of value loss. Plan a longer hold.
- Yuma County population projected at +4% by 2050 — modest demand growth; plan on rents tracking national, not racing it.
Negotiation context
- It's been on market 39 days — a 3% lower offer ($150k) is reasonable based on typical stale-listing flexibility.
- Current owner paid $62k; list at $155k implies a 150% gain — meaningful room to come down on a strong offer.
Risks & watch-outs
- Climate carrying-cost: extreme-heat days projected 7→20/yr by 2055 (HVAC capex compounding) — expect insurance premiums to compound above CPI over the hold.
Questions for the listing agent
- What do current leases actually rent for vs. the listed asking? Can we see a recent rent roll and the last 12 months of T-12 income?
- It's been on market 39 days. Have you received any prior offers? Is the seller open to a 25% concession, seller financing, or rate buy-down credit?
- What does the HOA fee cover, when was the last increase, and are there any pending special assessments or reserve-fund shortfalls?
- Is there a deadline driving the sale (1031 exchange, divorce, estate, relocation)? That informs how much negotiation room exists.
- The area grade is low — what's the realistic commute time and amenity access for the typical tenant pool here? Any planned neighborhood developments (good or bad) we should know about?
- What's the average days-on-market for RENTAL listings here right now (not sales)? A rising rental-DOM trend means longer vacancies and softer asking-rent achievability than the comps imply.
- What's the recent tenant-quality profile in this submarket — average credit score on applications, eviction rate, late-payment / NSF rate, and stable-employment percentage? A property-management company in the area should have these aggregated.
- How much new for-sale + rental construction is in the pipeline within 1–3 miles? Heavy new supply typically softens prices + rents 12–24 months out; constrained supply supports both.
Investment metrics
- 1% rule
- 0.75% ✗
- Cap rate
- 5.77%
- Cash-on-cash
- -1.87%
- DSCR
- 0.92
- GRM
- 11.1
CMA / ARV
- ARV (on-the-fly)
- $124,486
- Comps found
- 11
Show comp detail 11 sales within ~0.75 mi
| Address | Dist | Beds/Ba | Sqft | Sold | Price | $/sf | Match |
|---|---|---|---|---|---|---|---|
| 1867 W Camino Otero | 0.01mi | 2/2.0 | 910 (-2%) | 3mo | $115,000 | $126 | 94 |
| 2178 S Javelina Ave | 0.37mi | 3/2.0 (+1) | 930 (+0%) | 3mo | $125,000 | $134 | 75 |
| 2174 S Whitewing Ave | 0.31mi | 2/2.0 | 882 (-5%) | 4mo | $121,000 | $137 | 74 |
| 2166 S Javelina Ave | 0.38mi | 2/2.0 | 880 (-5%) | 3mo | $137,500 | $156 | 71 |
| 1927 W Camino Soledad | 0.06mi | 2/1.0 | 840 (-10%) | 10mo | $110,000 | $131 | 69 |
| 1841 W Camino Granada | 0.04mi | 2/2.0 | 825 (-11%) | 14mo | $118,000 | $143 | 68 |
| 1868 W Camino Pradera | 0.16mi | 3/3.0 (+1) | 902 (-3%) | 16mo | $100,000 | $111 | 65 |
| 2076 S Javelina Ave | 0.46mi | 2/2.0 | 924 (-0%) | 17mo | $132,500 | $143 | 63 |
| 2079 S Cottontail Ave | 0.50mi | 2/1.0 | 896 (-4%) | 6mo | $60,000 | $67 | 62 |
| 2041 S Coyote Ave | 0.44mi | 2/1.0 | 846 (-9%) | 9mo | $116,000 | $137 | 53 |
| 2161 S Sidewinder Ave | 0.47mi | 2/1.0 | 825 (-11%) | 4mo | $75,000 | $91 | 52 |
Match score weights: distance 35% · size 25% · config 20% · recency 20%. Top-matched comps best support the ARV.
Projected returns pro-forma
-3.0% appreciation · 2.04% rent growth · sell at horizon
- IRR
- -20.4%
- Equity multiple
- 0.30×
- Total profit
- $-30,564
- Equity at exit
- $23,111
- IRR
- -15.7%
- Equity multiple
- 0.15×
- Total profit
- $-36,778
- Equity at exit
- $13,402
Cash invested: $43,400 (down + closing). Projections, not guarantees.
Landlord ↔ Tenant lean methodology
- Overall (STATE)
- 87 Strongly Landlord-Friendly
- State Arizona
- 87 Strongly Landlord-Friendly · R+3
- County
- — inherits STATE
- City
- — inherits STATE
ZIP-level market 85364
- Rents YoY
- 2.0%
- Active inventory
- 262
- Price-to-rent
- 11.1×
Monthly cashflow live
- Estimated rent
- $1,168 high interval (Pro) →
- Mortgage (P&I)
- −$813
- Tax from tax record
- −$70 /mo · $839/yr
- Insurance
- −$65
- HOA
- −$43
- Vacancy / Maint / Mgmt
- −$245
- Net cashflow
- $-67
Break-even live
UW: 25.0% down · 7.5% · 30yr · 1.5% tax · 5.0% vac · 8.0% maint · 8.0% mgmt
Financing live
Cash to close
- Down payment
- $38,750
- Closing costs
- $4,650
- Reserves months
- —
- Total cash needed
- —
Loan-product check · same deal, 3 products live
Conventional
25% down · 7.5% · 30yr
- Down + closing
- —
- Monthly P&I
- —
- Monthly cashflow
- —
- DSCR
- —
- Eligible?
- —
Personal DTI + credit; lowest rate.
DSCR
20% down · 8.5% · 30yr
- Down + closing
- —
- Monthly P&I
- —
- Monthly cashflow
- —
- DSCR
- —
- Eligible?
- —
No personal income docs; deal must DSCR.
Hard money
10% down · 12.0% · 12mo
- Down + closing
- —
- Monthly P&I
- —
- Monthly cashflow
- —
- DSCR
- —
- Eligible?
- —
Short-term bridge; refi at stabilization.
Rent comps 25 comps
| Address | Beds | Baths | Sqft | Rent | $/sqft | DOM | Units | Dist |
|---|---|---|---|---|---|---|---|---|
| 1280 W 24th St Unit 37 Yuma, AZ | 1.0 | 1.0 | 650 | $900 | $1.38 | 21d | 1 | 0.40mi |
| 1280 W 24th St Apt 23 Yuma, AZ | 2.0 | 1.0 | 700 | $1,200 | $1.71 | 13d | 1 | 0.40mi |
| 1280 W 24th St Unit 32 Yuma, AZ | 2.0 | 1.0 | 700 | $1,200 | $1.71 | 21d | 1 | 0.40mi |
| 1280 W 24th St Unit 02 Yuma, AZ | 2.0 | 2.0 | 750 | $1,250 | $1.67 | 21d | 1 | 0.42mi |
| 2150 S Avenue A #26 Yuma, AZ | 2.0 | 2.0 | 905 | $1,550 | $1.71 | 13d | 1 | 0.49mi |
| 2100 S Avenue A Yuma, AZ | 1.0 | 1.0 | 594 | $1,010 | $1.70 | 13d | 1 | 0.53mi |
| 2150 S Avenue A #60 Yuma, AZ | 2.0 | 2.0 | 905 | $1,050 | $1.16 | 13d | 1 | 0.55mi |
| 2350 S Avenue B Yuma, AZ | 2.0 | 1.0–2.0 | 525 | $1,194 | $2.27 | 13d | 15 | 0.56mi |
| 2575 W 24th St Yuma, AZ | 1.0–2.0 | 1.0–2.0 | 764 | $1,830 | $2.39 | 13d | 8 | 0.58mi |
| 2200 S Avenue B Yuma, AZ | 1.0–3.0 | 1.0–2.0 | 889 | $965 | $1.09 | 13d | 7 | 0.58mi |
| 1910 S Avenue A Yuma, AZ | 2.0 | 1.0 | 543 | $970 | $1.79 | 13d | 5 | 0.64mi |
| 2044 S 11th Ave Unit 1 Yuma, AZ | 1.0 | 1.0 | 650 | $900 | $1.38 | 13d | 1 | 0.64mi |
| 1103 W 20th St Unit 1005 Yuma, AZ | 2.0 | 1.0 | 742 | $1,000 | $1.35 | 13d | 1 | 0.70mi |
| 1103 W 20th St Unit 1045 Yuma, AZ | 1.0 | 1.0 | 633 | $1,000 | $1.58 | 13d | 1 | 0.70mi |
| 1823 W 18th St Yuma, AZ | 1.0 | 1.0 | 600 | $1,149 | $1.92 | 13d | 1 | 0.72mi |
| 1900 W 30th St Yuma, AZ | 2.0–3.0 | 2.0 | 1024 | $804 | $0.79 | 13d | 1 | 0.75mi |
| 1850 S Avenue B Yuma, AZ | 2.0–3.0 | 2.0 | 1050 | $1,425 | $1.36 | 13d | 7 | 0.84mi |
| 1700 S Crowder Ave #16 Yuma, AZ | 2.0 | 2.0 | 1000 | $1,250 | $1.25 | 13d | 1 | 0.93mi |
| 2714 S Virginia Dr Yuma, AZ | 2.0 | 1.0 | 750 | $925 | $1.23 | 13d | 2 | 1.22mi |
| 2621 S Virginia Dr Unit 206 Yuma, AZ | 1.0 | 1.0 | 580 | $850 | $1.47 | 21d | 1 | 1.25mi |
| 2173 S 1st Ave Unit 10 Yuma, AZ | 1.0 | 1.0 | 550 | $850 | $1.55 | 21d | 1 | 1.30mi |
| 3900 W 22nd Ln Yuma, AZ | 2.0–3.0 | 2.0 | 971 | $1,350 | $1.39 | 13d | 6 | 1.41mi |
| 225 W Catalina Dr Yuma, AZ | 1.0–2.0 | 1.0–2.0 | 777 | $1,363 | $1.75 | 13d | 7 | 1.43mi |
| 1334 S Avenue B Yuma, AZ | 1.0–2.0 | 1.5–2.0 | 888 | $1,295 | $1.46 | 13d | 24 | 1.45mi |
| 2183 S Walnut Ave Unit 2 Yuma, AZ | 2.0 | 1.0 | 672 | $975 | $1.45 | 13d | 1 | 1.49mi |
HOA detail
- Monthly dues
- $43 · $516/yr
Listing history 21 events
-
2026-06-19days on market $155,000 Active 39 DOM
-
2026-06-18days on market $155,000 Active 38 DOM
-
2026-06-17days on market $155,000 Active 37 DOM
-
2026-06-16days on market $155,000 Active 36 DOM
-
2026-06-15days on market $155,000 Active 35 DOM
-
2026-06-14days on market $155,000 Active 33 DOM
-
2026-06-13days on market $155,000 Active 32 DOM
-
2026-06-10days on market $155,000 Active 30 DOM
-
2026-06-09days on market $155,000 Active 29 DOM
-
2026-06-08days on market $155,000 Active 28 DOM
-
2026-06-07days on market $155,000 Active 27 DOM
-
2026-06-05days on market $155,000 Active 24 DOM
-
2026-06-02days on market $155,000 Active 22 DOM
-
2026-06-01days on market $155,000 Active 21 DOM
-
2026-05-31days on market $155,000 Active 20 DOM
-
2026-05-30days on market $155,000 Active 19 DOM
-
2026-05-11$155,000 Active
-
2026-02-28price $152,900
-
2021-06-30soldstatus $62,000
-
2017-02-27soldstatus $55,000
-
1986-02-20soldstatus $17,500
ⓘ Source: listings_history table (triggers on properties + properties_extension) + one-shot
backfill from property_details.listing_events for pre-trigger history.
Tax reassessment forecast AZ · Resets to sale price
- Current annual tax
- $839 · $70/mo
- Projected year-2 tax
- $1,023 · $85/mo
- Expected delta
- +$184/yr (+$15/mo · 21.9%)
ⓘ Screening estimate from a state-policy table — verify with the county assessor before closing.
Climate risk First Street
- Flood 1/10 Low FEMA zone X (shaded) · 0% chance over 30 yrs
- Wildfire 1/10 Low
- Heat 9/10 Extreme 7 d/yr ≥113°F today · 20 d/yr by 30 yrs out
- Wind 1/10 Low
- Air quality 2/10 Low 2 unhealthy d/yr today · 2 by 30 yrs out
Nearby sold comps map
Loading sold comps map…
Walkable amenities ~0.75 mi
Loading nearby amenities…
Taxation est. · year 1
- Rental income
- $14,018
- − Mortgage interest
- −$8,682
- − Property taxes
- −$839
- − Insurance
- −$775
- − Repairs & maintenance
- −$1,121
- − Management
- −$1,121
- − HOA
- −$516
- − Depreciation
- −$4,509
- Taxable loss
- −$3,546
- Est. tax savings @ 24.0%
- +$851
- After-tax cash flow
- $41/yr
For passive investors: Depreciation is non-cash, so a rental often shows a tax loss while cash-flowing — sheltering income. Rental losses are passive: they offset passive income freely, and up to $25,000/yr can offset ordinary (W-2) income if you actively participate and your MAGI is under $100k (phasing out to $0 by $150k); unused losses carry forward. On sale, claimed depreciation is recaptured at up to 25%, and gains may owe capital-gains tax (a 1031 exchange can defer both). Figures are a year-1 estimate at your 24.0% rate — not tax advice; consult a CPA.
Schools (NCES district)
- District
- Crane Elementary District (4501)
- NCES district ID
- 0402400
- Math proficiency
- 21% ▼ -17.00%
- Reading proficiency
- 30% ▼ -10.00%
- Median HH income
- $49,115
- Composite
- 22.36/100
- National rank
- #8122
- State rank
- #134 of 249 in AZ
Livability — Yuma
- Score
- 71/100
- State rank
- #30
- US rank
- #6635
Category grades
Schools grade is shown separately in the Schools card above.
Census & demographics
- Census place
- Yuma, AZ
- County
- Yuma County · 149,809 people
- City population
- 149,809
- Metro
- Yuma, AZ
- Population (ZIP)
- 72,960
- Household income
- $57,874
- Rent vs Own
- Severe rent burden
- 2195.0
Population outlook (Yuma County) Hauer SSP2
- Today (2025)
- 211,633 people
- By 2030
- 214,114 · +1.2%
- By 2040
- 217,856 · +2.9%
- By 2050
- 220,276 · +4.1%
- By 2075
- 222,359 · +5.1%
- By 2100
- 198,880 · -6.0%
Race, ethnicity, and origin ACS 2023
- Neighborhood character
- Predominantly Hispanic (70%)
- Race & ethnicity
- Hispanic / Latino 70% Two or more races 29% White 24% Asian 2% Black 2% Native American 1%
- Hispanic origin (detail)
- Mexican 67%
- Common ancestry
- Portuguese 1% Lithuanian 1% Romanian 1%
- Foreign-born
- 22% · Canada
- Languages at home
- 48% English-only · Spanish 50% Tagalog/Filipino 1%
Political lean MEDSL · Yuma
- 2024 margin
- Strong R (+20.4) · D 39.3% · R 59.8%
- 2008→2024 swing
- -6.6pp toward R · 2008: -13.8pp · 2024: -20.4pp
- All cycles
- 2024: R+20.4 2020: R+6.2 2016: R+5.5 2012: R+16.1 2008: R+13.8
Not yet ingested
- Civics
- —
Market trends
- HPI YoY
- ▼ -197.00%
- Current HPI
- 220.8058
- Rent YoY
- ▲ 2.04%
- Metro
- Yuma, AZ
- State GDP YoY
- ▲ 4.54%
- F500 in state
- 20
Industry mix (Fortune 500 HQ in AZ)
| Industry | F500 HQs | Revenue |
|---|---|---|
| Technology | 2 | $13B |
|
||
| Mining / Metals | 1 | $23B |
|
||
| Environmental Services | 1 | $16B |
|
||
| Metals / Steel | 1 | $14B |
|
||
| Technology Distribution | 1 | $9B |
|
||
| Homebuilding | 1 | $8B |
|
||
Price history
+785.7% since first listed5 events — show timeline
- 2026-05-11 Listed $155,000 YAR
- 2026-02-28 Price Changed $152,900 YAR
- 2021-06-30 Sold (Public Records) $62,000 Public Records
- 2017-02-27 Sold (Public Records) $55,000 Public Records
- 1986-02-20 Sold (Public Records) $17,500 Public Records
Property tax history
+2.9%/yrLatest (2025): $839 · +4.0% YoY. Source: county tax records.
Cash-flow waterfall
monthlySold comps — $/sqft
last 12 mo · ≤1 miLoading sold comps…