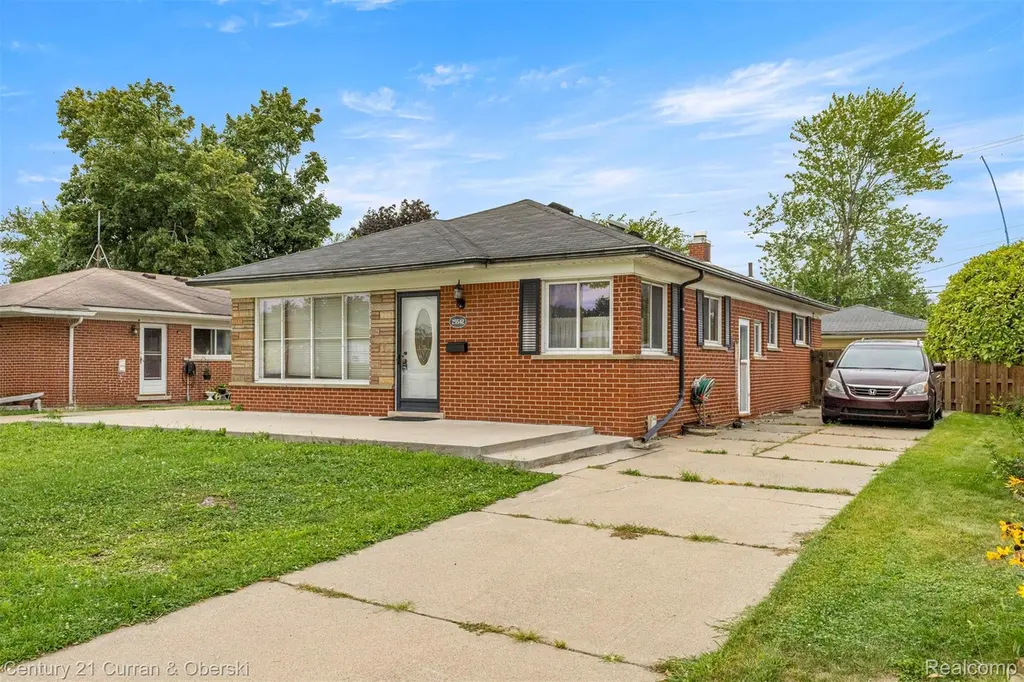
25542 W Warren St
Dearborn Heights, MI 48127
$319,900F
3 bd · 1.5 ba ·
1,232 sqft ·
Built 1957
· SingleFamily
· Active
· 296 DOM
Cashflow @ list (25.0% down · 7.5%)
Estimated rent
$1,788/mo
Mortgage (P&I)
−$1,678
Tax + insurance
−$386
HOA
−$0
Vac / Maint / Mgmt
−$375
Net cashflow
$-651/mo
Annual
$-7,813/yr
Cap rate
3.85%
Cash-on-cash
-8.72%
DSCR
0.61
1% rule
0.56%
Cash to close
$89,572
Investor read
- This is a 3-bed/1.5-bath single-family listed at $320k.
- At list price, monthly cash flow is $-651 ($-8k/yr) — negative.
- To cash-flow at today's rent, offer at most $205k (36.0% below list).
- To meet the 1% rule (rent ≥ 1% of price), the offer needs to be $179k (44.1% below list).
- It's been on market 296 days — a 12% lower offer ($282k) is reasonable based on typical stale-listing flexibility.
- Recommended offer: $179k (44.1% below list) — sets the bar for 1% rule.
- Local home prices are declining (-3.0%/yr); year-one equity from $2k of loan paydown is wiped out by about $10k of value loss. Plan a longer hold.
- Location reads 79/100 on livability (#82 in MI, #1,885 nationally) — a middle-class / working-renter tenant base. Strengths: commute A+, cost of living A+, housing A+; Watch: schools C-, crime D+, employment D+.
- Crestwood School District (suburban): math 32% / reading 43% proficiency, ranked #242 of 540 in MI (top 45%) — families likely to look elsewhere, expect single-tenant / working-renter base with shorter leases.
- Watch-outs: built in 1957 — expect roof / HVAC / electrical / plumbing capex.
- Market conditions: Rents flat; 143 active listings in the ZIP; 18 comparable units currently listed for rent nearby; rentals at typical pace (median 18d on market — plan ~3-4 weeks tenant-placement turnaround); 2,639 units permitted in Wayne County in 2024 (1,216 in 5+ unit buildings).
- Wayne County population projected at -17% by 2050 — secular population decline; favor cash flow + early exit over multi-decade hold.
- 6 sale attempts since 8y ago with the ask held roughly flat each time — persistent listings suggest the price (not the market) is what's stuck; bring a comps-based counter.
- Current owner paid $150k; list at $320k implies a 113% gain — meaningful room to come down on a strong offer.
- Cap rate 3.9% vs local median 5.5% in Dearborn Heights — below-typical yield; the buyer is paying a premium for something (appreciation thesis, condition, location) that the cap rate doesn't capture.
- This rent runs 35% of the median local income ($61k/yr) — at the standard rent-burdened threshold; future hikes will face affordability resistance.
Questions for listing agent
- What do current leases actually rent for vs. the listed asking? Can we see a recent rent roll and the last 12 months of T-12 income?
- It's been on market 296 days. Have you received any prior offers? Is the seller open to a 44% concession, seller financing, or rate buy-down credit?
- Built in 1957 — when were the roof, HVAC, electrical panel, plumbing, and water heater last replaced?
- Why hasn't it sold? Are there any deal-killer items the seller is aware of (foundation, flood, title, zoning, code violations)?
- Is there a deadline driving the sale (1031 exchange, divorce, estate, relocation)? That informs how much negotiation room exists.
- Crime grade is D in this area — have there been break-ins, vandalism, or insurance claims at this property in the last 3 years? What carrier currently insures it and at what premium?
- The area grade is low — what's the realistic commute time and amenity access for the typical tenant pool here? Any planned neighborhood developments (good or bad) we should know about?
- What's the average days-on-market for RENTAL listings here right now (not sales)? A rising rental-DOM trend means longer vacancies and softer asking-rent achievability than the comps imply.
CashFlowRE · CFR-M0X5EBAHG7TMDF
· Data 2 days ago
cashflowre.app · 2026-05-29