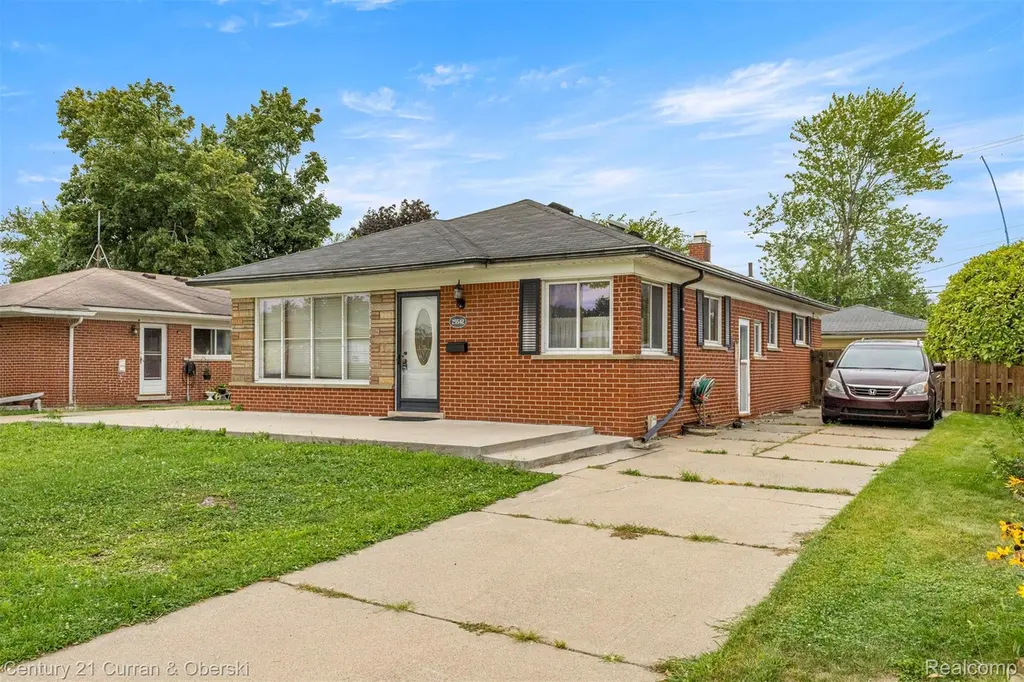
25542 W Warren St · Dearborn Heights, MI
Flood risk 1/10 · Minimal
- FEMA flood zone
- X (unshaded)
- Chance of flooding over 30 yrs
- 0.0%
- Est. flood insurance / yr
- $473 – $860
Fire risk 1/10 · Minimal
- Est. fire insurance / yr
- $784 – $1,456
Heat risk 3/10 · Minor
- Hot days now (above 98°F)
- 7 days/yr
- Hot days in 30 yrs
- 15 days/yr
Wind risk 2/10 · Minimal
- Chance of severe wind over 30 yrs
- —
Air-quality risk 2/10 · Minimal
- Unhealthy air days now
- 1 days/yr
- Unhealthy air days in 30 yrs
- 2 days/yr
Risk factors via First Street. Map © Google.
Why this score? — see what drove the F grade
The composite is a weighted blend of 9 inputs, each scored 0–100. Each bar is that input's sub-score; the figure is the points it added to the 100-point composite (weight × sub-score).
- ARV discount +11.4/15.0
- Cash flow +5.7/30.0
- Livability +4.0/5.0
- Schools +3.2/10.0
- Rent growth +2.6/5.0
- Condition / age +2.5/5.0
- 1% rule +0.6/10.0
- DSCR +0.1/10.0
- Appreciation +0.0/10.0
$319,900
🖨 Deal sheet 📄 Offer letter ✓ Due diligence
Listing remarks MLS
Nice 3 bedroom brick ranch over 1,200 sqft, large finished basement with wet bar, living room with huge picture window, nice sized kitchen with lots of counter & cabinet space, dining area, 1 ½ baths, refinished hardwood floors, vinyl windows, lots of storage space in basement, backyard with new concrete patio, 2 car garage, nice curb appeal, dishwasher, dryer, microwave, stove, fridge & washer all included in sales price, Crestwood School District, great location across from Papaya Fruit Market, close to Riverside Middle School, Hillcrest Elementary School, Holy Cluck, Warren Valley Golf Course & much more, all data apx.
Key facts
- Wet bar
- Finished basement
- New concrete patio
Tags
Neighborhood map
What this means for you Summary
Snapshot
- This is a 3-bed/1.5-bath single-family listed at $320k.
Deal economics
- At list price, monthly cash flow is $-651 ($-8k/yr) — negative.
- To cash-flow at today's rent, offer at most $205k (36.0% below list).
- To meet the 1% rule (rent ≥ 1% of price), the offer needs to be $179k (44.1% below list).
- Recommended offer: $179k (44.1% below list) — sets the bar for 1% rule.
- Cap rate 3.9% vs local median 5.5% in Dearborn Heights — below-typical yield; the buyer is paying a premium for something (appreciation thesis, condition, location) that the cap rate doesn't capture.
Location & tenants
- Location reads 79/100 on livability (#82 in MI, #1,885 nationally) — a middle-class / working-renter tenant base. Strengths: commute A+, cost of living A+, housing A+; Watch: schools C-, crime D+, employment D+.
- Crestwood School District (suburban): math 32% / reading 43% proficiency, ranked #242 of 540 in MI (top 45%) — families likely to look elsewhere, expect single-tenant / working-renter base with shorter leases.
- Market conditions: Rents flat; 143 active listings in the ZIP; 18 comparable units currently listed for rent nearby; rentals at typical pace (median 18d on market — plan ~3-4 weeks tenant-placement turnaround); 2,639 units permitted in Wayne County in 2024 (1,216 in 5+ unit buildings).
- This rent runs 35% of the median local income ($61k/yr) — at the standard rent-burdened threshold; future hikes will face affordability resistance.
Forward outlook
- Local home prices are declining (-3.0%/yr); year-one equity from $2k of loan paydown is wiped out by about $10k of value loss. Plan a longer hold.
- Wayne County population projected at -17% by 2050 — secular population decline; favor cash flow + early exit over multi-decade hold.
Negotiation context
- It's been on market 296 days — a 12% lower offer ($282k) is reasonable based on typical stale-listing flexibility.
- 6 sale attempts since 8y ago with the ask held roughly flat each time — persistent listings suggest the price (not the market) is what's stuck; bring a comps-based counter.
- Current owner paid $150k; list at $320k implies a 113% gain — meaningful room to come down on a strong offer.
Risks & watch-outs
- Watch-outs: built in 1957 — expect roof / HVAC / electrical / plumbing capex.
Questions for the listing agent
- What do current leases actually rent for vs. the listed asking? Can we see a recent rent roll and the last 12 months of T-12 income?
- It's been on market 296 days. Have you received any prior offers? Is the seller open to a 44% concession, seller financing, or rate buy-down credit?
- Built in 1957 — when were the roof, HVAC, electrical panel, plumbing, and water heater last replaced?
- Why hasn't it sold? Are there any deal-killer items the seller is aware of (foundation, flood, title, zoning, code violations)?
- Is there a deadline driving the sale (1031 exchange, divorce, estate, relocation)? That informs how much negotiation room exists.
- Crime grade is D in this area — have there been break-ins, vandalism, or insurance claims at this property in the last 3 years? What carrier currently insures it and at what premium?
- The area grade is low — what's the realistic commute time and amenity access for the typical tenant pool here? Any planned neighborhood developments (good or bad) we should know about?
- What's the average days-on-market for RENTAL listings here right now (not sales)? A rising rental-DOM trend means longer vacancies and softer asking-rent achievability than the comps imply.
- What's the recent tenant-quality profile in this submarket — average credit score on applications, eviction rate, late-payment / NSF rate, and stable-employment percentage? A property-management company in the area should have these aggregated.
- How much new for-sale + rental construction is in the pipeline within 1–3 miles? Heavy new supply typically softens prices + rents 12–24 months out; constrained supply supports both.
Investment metrics
- 1% rule
- 0.56% ✗
- Cap rate
- 3.85%
- Cash-on-cash
- -8.72%
- DSCR
- 0.61
- GRM
- 14.9
CMA / ARV
- ARV (median comp)
- $349,906
- List price
- $319,900
- Delta
- -8.58%
- Verdict
- FAIR
- Comps
- 20 within 1.0 mi
Show comp detail 12 sales within ~0.75 mi
| Address | Dist | Beds/Ba | Sqft | Sold | Price | $/sf | Match |
|---|---|---|---|---|---|---|---|
| 7276 Colonial | 0.44mi | 3/2.0 | 1,215 (-1%) | 2mo | $215,000 | $177 | 73 |
| 7302 Nightingale St | 0.25mi | 3/1.0 | 1,118 (-9%) | 4mo | $155,000 | $139 | 68 |
| 7260 Fenton St | 0.62mi | 3/1.0 | 1,200 (-3%) | 3mo | $241,000 | $201 | 62 |
| 26511 W Warren St | 0.59mi | 3/2.0 | 1,216 (-1%) | 8mo | $225,000 | $185 | 62 |
| 7288 Kingsbury St | 0.50mi | 3/2.0 | 1,297 (+5%) | 8mo | $300,000 | $231 | 59 |
| 7139 Centralia St | 0.24mi | 3/2.0 | 1,053 (-14%) | 7mo | $205,000 | $195 | 57 |
| 25659 Baldwin St | 0.48mi | 3/1.5 | 1,080 (-12%) | 1mo | $281,000 | $260 | 56 |
| 6822 N Lafayette St | 0.61mi | 3/1.0 | 1,080 (-12%) | 0mo | $150,000 | $139 | 49 |
| 7479 N Charlesworth St | 0.71mi | 3/1.5 | 1,116 (-9%) | 4mo | $259,000 | $232 | 48 |
| 6633 Shadowlawn St | 0.63mi | 3/2.0 | 1,073 (-13%) | 0mo | $285,000 | $266 | 47 |
| 7420 Fenton St | 0.64mi | 2/1.0 (-1) | 1,080 (-12%) | 2mo | $160,000 | $148 | 41 |
| 6180 Colonial St | 0.75mi | 3/1.0 | 1,367 (+11%) | 5mo | $240,000 | $176 | 41 |
Match score weights: distance 35% · size 25% · config 20% · recency 20%. Top-matched comps best support the ARV.
Projected returns pro-forma
-3.0% appreciation · 0.41% rent growth · sell at horizon
- IRR
- -34.4%
- Equity multiple
- -0.09×
- Total profit
- $-97,912
- Equity at exit
- $47,698
- IRR
- -61.4%
- Equity multiple
- -0.75×
- Total profit
- $-156,612
- Equity at exit
- $27,659
Cash invested: $89,572 (down + closing). Projections, not guarantees.
Landlord ↔ Tenant lean methodology
- Overall (STATE)
- 62 Landlord-Friendly
- State Michigan
- 62 Landlord-Friendly · EVEN
- County
- — inherits STATE
- City
- — inherits STATE
ZIP-level market 48127
- Rents YoY
- 0.4%
- Active inventory
- 143
- Price-to-rent
- 14.9×
Monthly cashflow live
- Estimated rent
- $1,788 high interval (Pro) →
- Mortgage (P&I)
- −$1,678
- Tax from tax record
- −$253 /mo · $3,032/yr
- Insurance
- −$133
- HOA
- −$0
- Vacancy / Maint / Mgmt
- −$375
- Net cashflow
- $-651
Break-even live
UW: 25.0% down · 7.5% · 30yr · 1.5% tax · 5.0% vac · 8.0% maint · 8.0% mgmt
Financing live
Cash to close
- Down payment
- $79,975
- Closing costs
- $9,597
- Reserves months
- —
- Total cash needed
- —
Loan-product check · same deal, 3 products live
Conventional
25% down · 7.5% · 30yr
- Down + closing
- —
- Monthly P&I
- —
- Monthly cashflow
- —
- DSCR
- —
- Eligible?
- —
Personal DTI + credit; lowest rate.
DSCR
20% down · 8.5% · 30yr
- Down + closing
- —
- Monthly P&I
- —
- Monthly cashflow
- —
- DSCR
- —
- Eligible?
- —
No personal income docs; deal must DSCR.
Hard money
10% down · 12.0% · 12mo
- Down + closing
- —
- Monthly P&I
- —
- Monthly cashflow
- —
- DSCR
- —
- Eligible?
- —
Short-term bridge; refi at stabilization.
Rent comps 18 comps
| Address | Beds | Baths | Sqft | Rent | $/sqft | DOM | Units | Dist |
|---|---|---|---|---|---|---|---|---|
| 7014 Kinmore St Dearborn Heights, MI | 3.0 | 1.0 | 960 | $1,900 | $1.98 | 21d | 1 | 0.13mi |
| 7080 Highview St Dearborn Heights, MI | 3.0 | 2.5 | 1105 | $2,000 | $1.81 | 18d | 1 | 0.21mi |
| 181 Terri Dr Unit 181 Dearborn Heights, MI | 2.0 | 2.0 | 840 | $1,119 | $1.33 | 5d | 1 | 0.47mi |
| 79 3rd St Unit 79 Dearborn Heights, MI | 2.0 | 1.0 | 840 | $1,339 | $1.59 | 24d | 1 | 0.49mi |
| 7462 N Vernon St Dearborn Heights, MI | 4.0 | 1.0 | 1113 | $1,900 | $1.71 | 1d | 1 | 0.72mi |
| 26620 Baldwin St Dearborn Heights, MI | 3.0 | 1.5 | 1156 | $1,800 | $1.56 | 1d | 1 | 0.76mi |
| 7420 Drexel St Dearborn Heights, MI | 2.0 | 1.0 | 1080 | $1,700 | $1.57 | 43d | 1 | 0.77mi |
| 7420 Drexel St Dearborn Heights, MI | 2.0 | 1.0 | 1080 | $1,600 | $1.48 | 4d | 1 | 0.77mi |
| 7420 Drexel St Dearborn Heights, MI | 2.0 | 1.0 | 1080 | $1,700 | $1.57 | 17d | 1 | 0.77mi |
| 6978 Mayburn St Dearborn Heights, MI | 3.0 | 2.0 | 1250 | $1,800 | $1.44 | 43d | 1 | 0.82mi |
| 8402 Robindale Ave Dearborn Heights, MI | 3.0 | 1.0 | 1190 | $1,600 | $1.34 | 15d | 1 | 0.88mi |
| 8455 Robindale Ave Dearborn Heights, MI | 3.0 | 1.0 | 1100 | $1,750 | $1.59 | 4d | 1 | 0.90mi |
| 5722 Centralia St Dearborn Heights, MI | 3.0 | 1.0 | 999 | $1,750 | $1.75 | 1d | 1 | 0.92mi |
| 8187 Lenore St Dearborn Heights, MI | 2.0 | 1.0 | 768 | $1,550 | $2.02 | 43d | 1 | 0.95mi |
| 6954 Inkster Rd Dearborn Heights, MI | 1.0–2.0 | 1.0–1.5 | 837 | $1,339 | $1.60 | 2d | 9 | 1.14mi |
| 7618 Hazelton St Dearborn Heights, MI | 3.0 | 1.0 | 1310 | $1,700 | $1.30 | 17d | 1 | 1.35mi |
| 7048 Deering St Garden City, MI | 3.0 | 1.0 | 910 | $1,500 | $1.65 | 17d | 1 | 1.37mi |
| 27201 Canfield St W Dearborn Heights, MI | 1.0–2.0 | 1.0–2.0 | 852 | $1,499 | $1.76 | 1d | 22 | 1.38mi |
Listing history 30 events
-
2026-06-18days on market $319,900 Active 296 DOM
-
2026-06-17days on market $319,900 Active 295 DOM
-
2026-06-16days on market $319,900 Active 294 DOM
-
2026-06-15days on market $319,900 Active 293 DOM
-
2026-06-13days on market $319,900 Active 291 DOM
-
2026-06-13days on market $319,900 Active 290 DOM
-
2026-06-09days on market $319,900 Active 287 DOM
-
2026-06-08days on market $319,900 Active 286 DOM
-
2026-06-07days on market $319,900 Active 285 DOM
-
2026-06-04days on market $319,900 Active 282 DOM
-
2026-06-03days on market $319,900 Active 281 DOM
-
2026-06-02days on market $319,900 Active 280 DOM
-
2026-06-01days on market $319,900 Active 279 DOM
-
2026-05-31days on market $319,900 Active 278 DOM
-
2025-08-26$319,900 Active 654-char remark
Show marketing remark (661 chars)
Nice 3 bedroom brick ranch over 1,200 sqft, large finished basement with wet bar, living room with huge picture window, nice sized kitchen with lots of counter & cabinet space, dining area, 1 ½ baths, refinished hardwood floors, vinyl windows, lots of storage space in basement, backyard with new concrete patio, 2 car garage, nice curb appeal, dishwasher, dryer, microwave, stove, fridge & washer all included in sales price, Crestwood School District, great location across from Papaya Fruit Market, close to Riverside Middle School, Hillcrest Elementary School, Holy Cluck, Warren Valley Golf Course & much more, all data apx.
-
2025-08-26$319,900 Active 661-char remark
Show marketing remark (661 chars)
Nice 3 bedroom brick ranch over 1,200 sqft, large finished basement with wet bar, living room with huge picture window, nice sized kitchen with lots of counter & cabinet space, dining area, 1 ½ baths, refinished hardwood floors, vinyl windows, lots of storage space in basement, backyard with new concrete patio, 2 car garage, nice curb appeal, dishwasher, dryer, microwave, stove, fridge & washer all included in sales price, Crestwood School District, great location across from Papaya Fruit Market, close to Riverside Middle School, Hillcrest Elementary School, Holy Cluck, Warren Valley Golf Course & much more, all data apx.
-
2020-03-13historical
-
2020-03-13historical
-
2020-02-27price $179,700
-
2020-02-26price $179,700
-
2020-01-09$169,900 Active
-
2020-01-09$169,900 Active
-
2018-06-26soldstatus $150,000
-
2018-06-20historical
-
2018-06-14soldstatus $150,000 Sold
-
2018-06-14soldstatus $150,000 Closed
-
2018-06-05status Pending
-
2018-06-05status Pending
-
2018-05-23$159,900 Active
-
2018-05-23$159,900 Active
ⓘ Source: listings_history table (triggers on properties + properties_extension) + one-shot
backfill from property_details.listing_events for pre-trigger history.
Tax reassessment forecast MI · Partial reset (capped growth)
- Current annual tax
- $3,032 · $253/mo
- Projected year-2 tax
- $3,979 · $332/mo
- Expected delta
- +$947/yr (+$79/mo · 31.2%)
ⓘ Screening estimate from a state-policy table — verify with the county assessor before closing.
Climate risk First Street
- Flood 1/10 Low FEMA zone X (unshaded) · 0% chance over 30 yrs
- Wildfire 1/10 Low
- Heat 3/10 Moderate 7 d/yr ≥98°F today · 15 d/yr by 30 yrs out
- Wind 2/10 Low
- Air quality 2/10 Low 1 unhealthy d/yr today · 2 by 30 yrs out
Nearby sold comps map
Loading sold comps map…
Walkable amenities ~0.75 mi
Loading nearby amenities…
Taxation est. · year 1
- Rental income
- $21,454
- − Mortgage interest
- −$17,919
- − Property taxes
- −$3,032
- − Insurance
- −$1,600
- − Repairs & maintenance
- −$1,716
- − Management
- −$1,716
- − Depreciation
- −$9,306
- Taxable loss
- −$13,835
- Est. tax savings @ 24.0%
- +$3,320
- After-tax cash flow
- $-4,493/yr
For passive investors: Depreciation is non-cash, so a rental often shows a tax loss while cash-flowing — sheltering income. Rental losses are passive: they offset passive income freely, and up to $25,000/yr can offset ordinary (W-2) income if you actively participate and your MAGI is under $100k (phasing out to $0 by $150k); unused losses carry forward. On sale, claimed depreciation is recaptured at up to 25%, and gains may owe capital-gains tax (a 1031 exchange can defer both). Figures are a year-1 estimate at your 24.0% rate — not tax advice; consult a CPA.
Schools (NCES district)
- District
- Crestwood School District
- NCES district ID
- 2600016
- Math proficiency
- 32% ▼ -6.00%
- Reading proficiency
- 43% ▼ -4.00%
- Median HH income
- $47,101
- Composite
- 32.1/100
- National rank
- #5806
- State rank
- #242 of 540 in MI
Livability — Dearborn Heights
- Score
- 79/100
- State rank
- #82
- US rank
- #1885
Category grades
Schools grade is shown separately in the Schools card above.
Census & demographics
- Census place
- Dearborn Heights, MI
- County
- Wayne County · 1,562,939 people
- City population
- 61,771
- Metro
- Detroit-Warren-Dearborn, MI
- Population (ZIP)
- 39,646
- Household income
- $60,742
- Rent vs Own
- Severe rent burden
- 1196.0
Population outlook (Wayne County) Hauer SSP2
- Today (2025)
- 1,675,273 people
- By 2030
- 1,620,300 · -3.3%
- By 2040
- 1,502,341 · -10.3%
- By 2050
- 1,384,039 · -17.4%
- By 2075
- 1,124,592 · -32.9%
- By 2100
- 881,193 · -47.4%
Race, ethnicity, and origin ACS 2023
- Neighborhood character
- Predominantly White (85%)
- Race & ethnicity
- White 85% Black 8% Two or more races 3% Hispanic / Latino 3% Asian 2%
- Common ancestry
- Arab 8% Romanian 7% Lithuanian 2%
- Foreign-born
- 31% · Canada
- Languages at home
- 46% English-only · Arabic 45% Russian/Polish/Slavic 2% Other Indo-European 2%
Political lean MEDSL · Wayne
- 2024 margin
- Strong D (+29.0) · D 62.7% · R 33.7% · Other 3.6%
- 2008→2024 swing
- -20.5pp toward R · 2008: 49.5pp · 2024: 29.0pp
- All cycles
- 2024: D+29.0 2020: D+38.1 2016: D+37.3 2012: D+46.9 2008: D+49.5
Not yet ingested
- Civics
- —
Market trends
- HPI YoY
- ▼ -319.04%
- Current HPI
- 225.9407
- Rent YoY
- ▲ 0.41%
- Metro
- Detroit-Warren-Dearborn, MI
- State GDP YoY
- ▲ 1.37%
- F500 in state
- 28
Industry mix (Fortune 500 HQ in MI)
| Industry | F500 HQs | Revenue |
|---|---|---|
| Automotive Parts | 3 | $48B |
|
||
| Automotive | 2 | $372B |
|
||
| Chemicals | 1 | $45B |
|
||
| Automotive Retail | 1 | $29B |
|
||
| Healthcare / Medical Devices | 1 | $23B |
|
||
| Automotive Technology | 1 | $20B |
|
||
Price history
+100.1% since first listed16 events — show timeline
- 2025-08-26 Listed $319,900 MiRealSource-MiMLS
- 2025-08-26 Listed $319,900 REALCOMP
- 2020-03-13 Listing Removed — REALCOMP
- 2020-03-13 Listing Removed — MiRealSource-MiMLS
- 2020-02-27 Price Changed $179,700 MiRealSource-MiMLS
- 2020-02-26 Price Changed $179,700 REALCOMP
- 2020-01-09 Listed $169,900 MiRealSource-MiMLS
- 2020-01-09 Listed $169,900 REALCOMP
- 2018-06-26 Sold (Public Records) $150,000 Public Records
- 2018-06-20 Listing Removed — MiRealSource-MiMLS
- 2018-06-14 Sold (MLS) $150,000 MiRealSource-MiMLS
- 2018-06-14 Sold (MLS) $150,000 REALCOMP
- 2018-06-05 Pending — MiRealSource-MiMLS
- 2018-06-05 Pending — REALCOMP
- 2018-05-23 Listed $159,900 MiRealSource-MiMLS
- 2018-05-23 Listed $159,900 REALCOMP
Property tax history
+5.2%/yrLatest (2025): $3,032 · -19.7% YoY. Source: county tax records.
Cash-flow waterfall
monthlySold comps — $/sqft
last 12 mo · ≤1 miLoading sold comps…