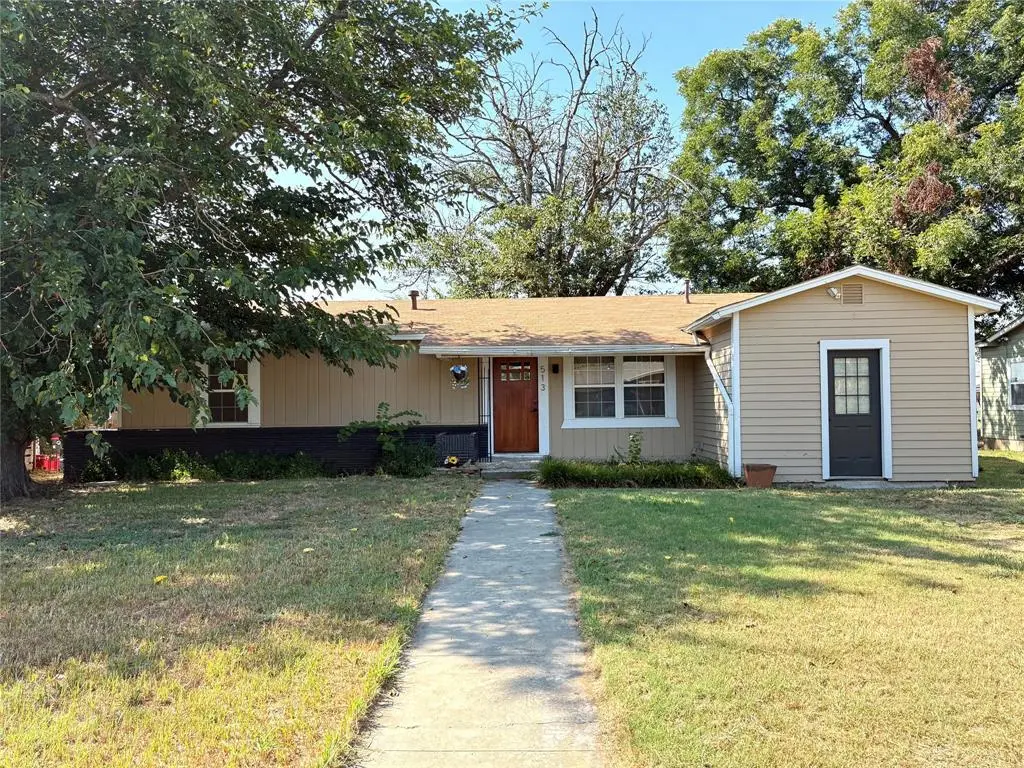
513 E Conner St
Eastland, TX 76448
$135,000D
3 bd · 1.0 ba ·
1,458 sqft ·
Built 1950
· SingleFamily
· Pending
· 291 DOM
Cashflow @ list (25.0% down · 7.5%)
Estimated rent
$1,065/mo
Mortgage (P&I)
−$708
Tax + insurance
−$214
HOA
−$0
Vac / Maint / Mgmt
−$224
Net cashflow
$-81/mo
Annual
$-968/yr
Cap rate
5.58%
Cash-on-cash
-2.56%
DSCR
0.89
1% rule
0.79%
Cash to close
$37,800
Investor read
- This is a 3-bed/1.0-bath single-family listed at $135k.
- At list price, monthly cash flow is $-81 ($-968/yr) — negative.
- To cash-flow at today's rent, offer at most $121k (10.6% below list).
- To meet the 1% rule (rent ≥ 1% of price), the offer needs to be $106k (21.1% below list).
- It's been on market 291 days — a 12% lower offer ($119k) is reasonable based on typical stale-listing flexibility.
- Recommended offer: $106k (21.1% below list) — sets the bar for 1% rule.
- Local home prices are declining (-3.0%/yr); year-one equity from $933 of loan paydown is wiped out by about $4k of value loss. Plan a longer hold.
- Location reads 76/100 on livability (#104 in TX, #3,483 nationally) — a middle-class / working-renter tenant base. Strengths: cost of living A+, housing A+, health & safety A+; Watch: amenities F, commute F, employment F.
- Eastland ISD (town): math 45% / reading 41% proficiency, ranked #349 of 826 in TX (top 42%) — families likely to look elsewhere, expect single-tenant / working-renter base with shorter leases.
- Zoned schools: Siebert El (math 49% / reading 43%, grade D-, #1,097 of 4,322 statewide, top 26%, 491 students, 65% FRL); Eastland Middle (math 41% / reading 36%, grade F, #704 of 1,662 statewide, top 43%, 257 students, 59% FRL); Eastland H S (math 42% / reading 47%, grade F, #652 of 1,632 statewide, top 43%, 309 students, 57% FRL).
- Watch-outs: built in 1950 — expect roof / HVAC / electrical / plumbing capex.
- Market conditions: 84 active listings in the ZIP; 2 comparable units currently listed for rent nearby; 10 units permitted in Eastland County in 2024 (0 in 5+ unit buildings).
- Eastland County population projected at -14% by 2050 — secular population decline; favor cash flow + early exit over multi-decade hold.
- 4 sale attempts since 16y ago with the ask held roughly flat each time — persistent listings suggest the price (not the market) is what's stuck; bring a comps-based counter.
- Climate carrying-cost: major wind risk, 27% chance of damaging wind over 30y; major wildfire risk; extreme-heat days projected 7→23/yr by 2055 (HVAC capex compounding) — expect insurance premiums to compound above CPI over the hold.
- Cap rate 5.6% vs local median 3.1% in Eastland — top-decile yield for the area; either an underpriced asset or a hidden risk that comps aren't pricing in. Stress-test before assuming the spread holds.
Questions for listing agent
- What do current leases actually rent for vs. the listed asking? Can we see a recent rent roll and the last 12 months of T-12 income?
- It's been on market 291 days. Have you received any prior offers? Is the seller open to a 21% concession, seller financing, or rate buy-down credit?
- Built in 1950 — when were the roof, HVAC, electrical panel, plumbing, and water heater last replaced?
- Why hasn't it sold? Are there any deal-killer items the seller is aware of (foundation, flood, title, zoning, code violations)?
- Is there a deadline driving the sale (1031 exchange, divorce, estate, relocation)? That informs how much negotiation room exists.
- Schools are D-rated, which usually means shorter tenancies and higher turnover. Who's the typical renter profile here, and what's been the actual vacancy rate?
- The area grade is low — what's the realistic commute time and amenity access for the typical tenant pool here? Any planned neighborhood developments (good or bad) we should know about?
- What's the average days-on-market for RENTAL listings here right now (not sales)? A rising rental-DOM trend means longer vacancies and softer asking-rent achievability than the comps imply.
CashFlowRE · CFR-M13FPH30AYNDXZ
· Data 3 weeks ago
cashflowre.app · 2026-05-29