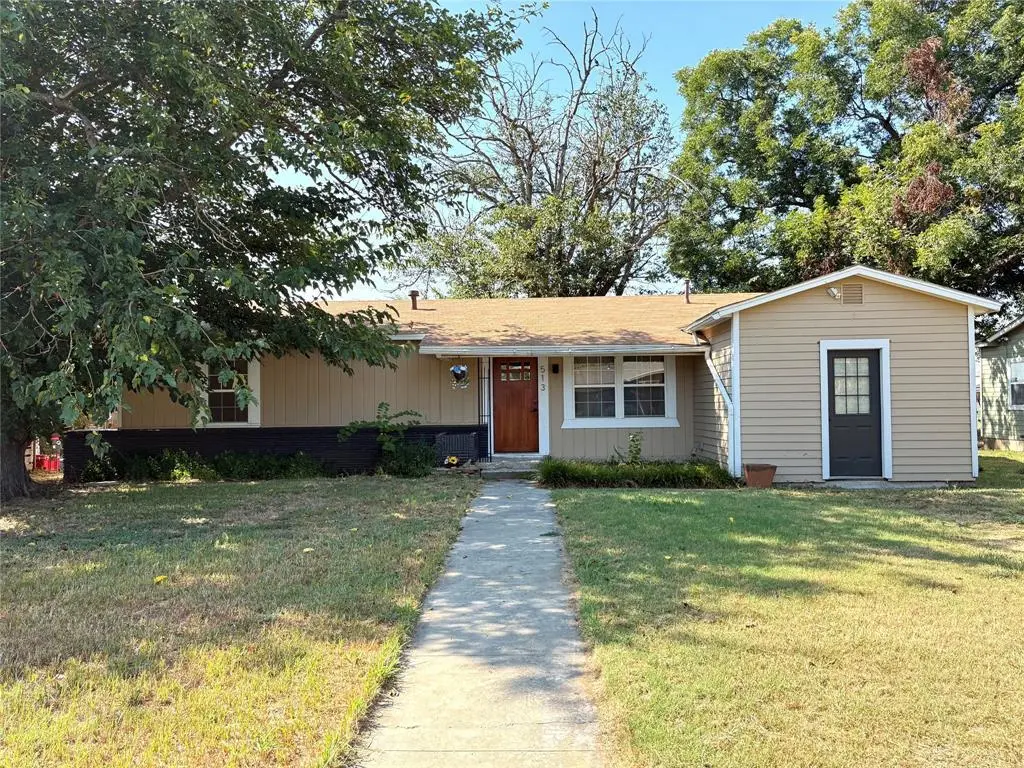
513 E Conner St · Eastland, TX
Flood risk 1/10 · Minimal
- FEMA flood zone
- X
- Chance of flooding over 30 yrs
- 0.0%
- Est. flood insurance / yr
- $507 – $1,088
Fire risk 6/10 · Moderate
- Est. fire insurance / yr
- $1,222 – $2,270
Heat risk 7/10 · Major
- Hot days now (above 106°F)
- 7 days/yr
- Hot days in 30 yrs
- 23 days/yr
Wind risk 6/10 · Moderate
- Chance of severe wind over 30 yrs
- 27.0%
Air-quality risk 1/10 · Minimal
- Unhealthy air days now
- 0 days/yr
- Unhealthy air days in 30 yrs
- 0 days/yr
Risk factors via First Street. Map © Google.
Why this score? — see what drove the D grade
The composite is a weighted blend of 9 inputs, each scored 0–100. Each bar is that input's sub-score; the figure is the points it added to the 100-point composite (weight × sub-score).
- ARV discount +14.1/15.0
- Cash flow +10.0/30.0
- Livability +3.8/5.0
- Schools +3.6/10.0
- 1% rule +2.9/10.0
- DSCR +2.9/10.0
- Rent growth +2.5/5.0
- Condition / age +2.5/5.0
- Appreciation +0.0/10.0
$135,000
🖨 Deal sheet (PDF) 📄 Offer letter ✓ Due diligence
Listing remarks MLS
Looking for a 3 bedroom home that won't break the budget? This one might be it! This property features 3 bedrooms, a nice layout, original harwood floors, and a quiet location. It has a huge kitchen and a fenced yard. It is ready to move in now or could be customized to make it your own. Investor? This would also make a great rental property. Come take a look!
Key facts
- Fenced yard
- Huge kitchen
- Quiet location
Tags
Neighborhood map
What this means for you Summary
Snapshot
- This is a 3-bed/1.0-bath single-family listed at $135k.
Deal economics
- At list price, monthly cash flow is $-81 ($-968/yr) — negative.
- To cash-flow at today's rent, offer at most $121k (10.6% below list).
- To meet the 1% rule (rent ≥ 1% of price), the offer needs to be $106k (21.1% below list).
- Recommended offer: $106k (21.1% below list) — sets the bar for 1% rule.
- Cap rate 5.6% vs local median 3.1% in Eastland — top-decile yield for the area; either an underpriced asset or a hidden risk that comps aren't pricing in. Stress-test before assuming the spread holds.
Location & tenants
- Location reads 76/100 on livability (#104 in TX, #3,483 nationally) — a middle-class / working-renter tenant base. Strengths: cost of living A+, housing A+, health & safety A+; Watch: amenities F, commute F, employment F.
- Eastland ISD (town): math 45% / reading 41% proficiency, ranked #349 of 826 in TX (top 42%) — families likely to look elsewhere, expect single-tenant / working-renter base with shorter leases.
- Zoned schools: Siebert El (math 49% / reading 43%, grade D-, #1,097 of 4,322 statewide, top 26%, 491 students, 65% FRL); Eastland Middle (math 41% / reading 36%, grade F, #704 of 1,662 statewide, top 43%, 257 students, 59% FRL); Eastland H S (math 42% / reading 47%, grade F, #652 of 1,632 statewide, top 43%, 309 students, 57% FRL).
- Market conditions: 84 active listings in the ZIP; 2 comparable units currently listed for rent nearby; 10 units permitted in Eastland County in 2024 (0 in 5+ unit buildings).
Forward outlook
- Local home prices are declining (-3.0%/yr); year-one equity from $933 of loan paydown is wiped out by about $4k of value loss. Plan a longer hold.
- Eastland County population projected at -14% by 2050 — secular population decline; favor cash flow + early exit over multi-decade hold.
Negotiation context
- It's been on market 291 days — a 12% lower offer ($119k) is reasonable based on typical stale-listing flexibility.
- 4 sale attempts since 16y ago with the ask held roughly flat each time — persistent listings suggest the price (not the market) is what's stuck; bring a comps-based counter.
Risks & watch-outs
- Watch-outs: built in 1950 — expect roof / HVAC / electrical / plumbing capex.
- Climate carrying-cost: major wind risk, 27% chance of damaging wind over 30y; major wildfire risk; extreme-heat days projected 7→23/yr by 2055 (HVAC capex compounding) — expect insurance premiums to compound above CPI over the hold.
Questions for the listing agent
- What do current leases actually rent for vs. the listed asking? Can we see a recent rent roll and the last 12 months of T-12 income?
- It's been on market 291 days. Have you received any prior offers? Is the seller open to a 21% concession, seller financing, or rate buy-down credit?
- Built in 1950 — when were the roof, HVAC, electrical panel, plumbing, and water heater last replaced?
- Why hasn't it sold? Are there any deal-killer items the seller is aware of (foundation, flood, title, zoning, code violations)?
- Is there a deadline driving the sale (1031 exchange, divorce, estate, relocation)? That informs how much negotiation room exists.
- Schools are D-rated, which usually means shorter tenancies and higher turnover. Who's the typical renter profile here, and what's been the actual vacancy rate?
- The area grade is low — what's the realistic commute time and amenity access for the typical tenant pool here? Any planned neighborhood developments (good or bad) we should know about?
- What's the average days-on-market for RENTAL listings here right now (not sales)? A rising rental-DOM trend means longer vacancies and softer asking-rent achievability than the comps imply.
- What's the recent tenant-quality profile in this submarket — average credit score on applications, eviction rate, late-payment / NSF rate, and stable-employment percentage? A property-management company in the area should have these aggregated.
- How much new for-sale + rental construction is in the pipeline within 1–3 miles? Heavy new supply typically softens prices + rents 12–24 months out; constrained supply supports both.
Investment metrics
- 1% rule
- 0.79% ✗
- Cap rate
- 5.58%
- Cash-on-cash
- -2.56%
- DSCR
- 0.89
- GRM
- 10.6
CMA / ARV
- ARV (median comp)
- $158,073
- List price
- $135,000
- Delta
- -14.60%
- Verdict
- UNDERPRICED
- Comps
- 20 within 1.0 mi
Show comp detail 12 sales within ~0.75 mi
| Address | Dist | Beds/Ba | Sqft | Sold | Price | $/sf | Match |
|---|---|---|---|---|---|---|---|
| 504 Garvin St | 0.09mi | 4/2.0 (+1) | 1,401 (-4%) | 6mo | $148,996 | $106 | 75 |
| 417 Lens St | 0.19mi | 3/2.0 | 1,363 (-6%) | 2mo | $272,500 | $200 | 75 |
| 424 Lens St | 0.16mi | 4/2.0 (+1) | 1,401 (-4%) | 5mo | $148,996 | $106 | 73 |
| 408 Lens St | 0.18mi | 4/2.0 (+1) | 1,401 (-4%) | 4mo | $147,090 | $105 | 73 |
| 520 Lens St | 0.15mi | 4/2.0 (+1) | 1,401 (-4%) | 6mo | $151,988 | $108 | 73 |
| 508 Garvin St | 0.09mi | 4/2.5 (+1) | 1,600 (+10%) | 2mo | $147,990 | $92 | 67 |
| 417 Garvin St | 0.12mi | 4/2.5 (+1) | 1,600 (+10%) | 3mo | $153,490 | $96 | 65 |
| 524 Lens St | 0.14mi | 4/2.5 (+1) | 1,600 (+10%) | 2mo | $149,990 | $94 | 64 |
| 910 S Seaman St | 0.33mi | 3/2.0 | 1,364 (-6%) | 7mo | $199,000 | $146 | 64 |
| 428 Lens St | 0.15mi | 4/2.5 (+1) | 1,600 (+10%) | 6mo | $159,997 | $100 | 61 |
| 608 S Seaman St | 0.40mi | 2/1.0 (-1) | 1,343 (-8%) | 4mo | $153,000 | $114 | 59 |
| 300 E Plummer St | 0.55mi | 2/2.0 (-1) | 1,274 (-13%) | 2mo | $135,000 | $106 | 42 |
Match score weights: distance 35% · size 25% · config 20% · recency 20%. Top-matched comps best support the ARV.
Projected returns pro-forma
-3.0% appreciation · 3.0% rent growth · sell at horizon
- IRR
- -20.5%
- Equity multiple
- 0.29×
- Total profit
- $-27,003
- Equity at exit
- $20,129
- IRR
- -13.7%
- Equity multiple
- 0.20×
- Total profit
- $-30,090
- Equity at exit
- $11,672
Cash invested: $37,800 (down + closing). Projections, not guarantees.
Landlord ↔ Tenant lean methodology
- Overall (STATE)
- 87 Strongly Landlord-Friendly
- State Texas
- 87 Strongly Landlord-Friendly · R+5
- County
- — inherits STATE
- City
- — inherits STATE
ZIP-level market 76448
- Home prices YoY
- -21.7%
- Active inventory
- 84
- Price-to-rent
- 10.6×
Monthly cashflow live
- Estimated rent
- $1,065 medium interval (Pro) →
- Mortgage (P&I)
- −$708
- Tax from tax record
- −$158 /mo · $1,892/yr
- Insurance
- −$56
- HOA
- −$0
- Vacancy / Maint / Mgmt
- −$224
- Net cashflow
- $-81
Break-even live
Sensitivity live
| Price | -10% $-4 | -5% $-42 | +0% $-81 | +5% $-119 | +10% $-157 |
|---|---|---|---|---|---|
| Rent | -10% $-165 | -5% $-123 | +0% $-81 | +5% $-39 | +10% $3 |
| Rate | -1.0pp $-13 | -0.5pp $-46 | base $-81 | +0.5pp $-116 | +1.0pp $-151 |
UW: 25.0% down · 7.5% · 30yr · 1.5% tax · 5.0% vac · 8.0% maint · 8.0% mgmt
Financing live
Cash to close
- Down payment
- $33,750
- Closing costs
- $4,050
- Reserves months
- —
- Total cash needed
- —
Loan-product check · same deal, 3 products live
Conventional
25% down · 7.5% · 30yr
- Down + closing
- —
- Monthly P&I
- —
- Monthly cashflow
- —
- DSCR
- —
- Eligible?
- —
Personal DTI + credit; lowest rate.
DSCR
20% down · 8.5% · 30yr
- Down + closing
- —
- Monthly P&I
- —
- Monthly cashflow
- —
- DSCR
- —
- Eligible?
- —
No personal income docs; deal must DSCR.
Hard money
10% down · 12.0% · 12mo
- Down + closing
- —
- Monthly P&I
- —
- Monthly cashflow
- —
- DSCR
- —
- Eligible?
- —
Short-term bridge; refi at stabilization.
Rent comps 2 comps
| Address | Beds | Baths | Sqft | Rent | $/sqft | DOM | Units | Dist |
|---|---|---|---|---|---|---|---|---|
| 701 S Marsh St Unit D Eastland, TX | 2.0 | 1.5 | 1066 | $1,100 | $1.03 | 45d | 1 | 0.23mi |
| 600 W Sadosa St Unit 5 Eastland, TX | 2.0 | 1.0 | 896 | $940 | $1.05 | 45d | 1 | 0.70mi |
Listing history 11 events
-
2025-08-06$135,000 Active 362-char remark
Show marketing remark (362 chars)
Looking for a 3 bedroom home that won't break the budget? This one might be it! This property features 3 bedrooms, a nice layout, original harwood floors, and a quiet location. It has a huge kitchen and a fenced yard. It is ready to move in now or could be customized to make it your own. Investor? This would also make a great rental property. Come take a look!
-
2023-05-05soldstatus Closed 577-char remark
Show marketing remark (577 chars)
This pretty little 1458 Sq Ft 3 bed 1 bath home sits in a well-established, sweet little neighborhood in Eastland waiting for its family!! It has a good layout and a huge kitchen with an extra room and laundry off of it. This one would make a great rental property or even a first home for a family. Good size bedrooms and bathroom and extra space for lots of storage! Perfect size yard for low maintenance but enough for kids and pets to play! With just a little bit of TLC and your own touch added, this cute house could be your home!! All electric, city water, city sewer.
-
2023-05-02soldstatus
-
2023-05-02soldstatus
-
2023-03-29historical Active Contingent 577-char remark
Show marketing remark (577 chars)
This pretty little 1458 Sq Ft 3 bed 1 bath home sits in a well-established, sweet little neighborhood in Eastland waiting for its family!! It has a good layout and a huge kitchen with an extra room and laundry off of it. This one would make a great rental property or even a first home for a family. Good size bedrooms and bathroom and extra space for lots of storage! Perfect size yard for low maintenance but enough for kids and pets to play! With just a little bit of TLC and your own touch added, this cute house could be your home!! All electric, city water, city sewer.
-
2023-03-28$125,000 Active 577-char remark
Show marketing remark (577 chars)
This pretty little 1458 Sq Ft 3 bed 1 bath home sits in a well-established, sweet little neighborhood in Eastland waiting for its family!! It has a good layout and a huge kitchen with an extra room and laundry off of it. This one would make a great rental property or even a first home for a family. Good size bedrooms and bathroom and extra space for lots of storage! Perfect size yard for low maintenance but enough for kids and pets to play! With just a little bit of TLC and your own touch added, this cute house could be your home!! All electric, city water, city sewer.
-
2013-03-26soldstatus
-
2012-04-19historical
-
2011-06-20$67,500
-
2010-12-02historical
-
2010-06-01$75,000
ⓘ Source: listings_history table (triggers on properties + properties_extension) + one-shot
backfill from property_details.listing_events for pre-trigger history.
Tax reassessment forecast TX · Resets to sale price
- Current annual tax
- $1,892 · $158/mo
- Projected year-2 tax
- $2,470 · $206/mo
- Expected delta
- +$578/yr (+$48/mo · 30.5%)
ⓘ Screening estimate from a state-policy table — verify with the county assessor before closing.
Climate risk First Street
- Flood 1/10 Low FEMA zone X · 0% chance over 30 yrs
- Wildfire 6/10 Major
- Heat 7/10 Severe 7 d/yr ≥106°F today · 23 d/yr by 30 yrs out
- Wind 6/10 Major 27% chance of damaging wind over 30 yrs
- Air quality 1/10 Low 0 unhealthy d/yr today · 0 by 30 yrs out
Nearby sold comps map
Loading sold comps map…
Walkable amenities ~0.75 mi
Loading nearby amenities…
Taxation est. · year 1
- Rental income
- $12,779
- − Mortgage interest
- −$7,562
- − Property taxes
- −$1,892
- − Insurance
- −$675
- − Repairs & maintenance
- −$1,022
- − Management
- −$1,022
- − Depreciation
- −$3,927
- Taxable loss
- −$3,323
- Est. tax savings @ 24.0%
- +$797
- After-tax cash flow
- $-170/yr
For passive investors: Depreciation is non-cash, so a rental often shows a tax loss while cash-flowing — sheltering income. Rental losses are passive: they offset passive income freely, and up to $25,000/yr can offset ordinary (W-2) income if you actively participate and your MAGI is under $100k (phasing out to $0 by $150k); unused losses carry forward. On sale, claimed depreciation is recaptured at up to 25%, and gains may owe capital-gains tax (a 1031 exchange can defer both). Figures are a year-1 estimate at your 24.0% rate — not tax advice; consult a CPA.
Schools (NCES district)
- District
- Eastland ISD
- NCES district ID
- 4817960
- Math proficiency
- 45% ▼ -5.00%
- Reading proficiency
- 41% ▼ -8.00%
- Median HH income
- $35,347
- Composite
- 35.61/100
- National rank
- #4894
- State rank
- #349 of 826 in TX
Livability — Eastland
- Score
- 76/100
- State rank
- #104
- US rank
- #3483
Category grades
Schools grade is shown separately in the Schools card above.
Census & demographics
- Census place
- Eastland, TX
- Population (ZIP)
- 4,920
Population outlook (Eastland County) Hauer SSP2
- Today (2025)
- 17,433 people
- By 2030
- 16,908 · -3.0%
- By 2040
- 15,855 · -9.1%
- By 2050
- 14,906 · -14.5%
- By 2075
- 12,843 · -26.3%
- By 2100
- 10,344 · -40.7%
Race, ethnicity, and origin ACS 2023
- Neighborhood character
- Predominantly White (85%)
- Race & ethnicity
- White 85% Two or more races 11% Hispanic / Latino 10% Black 3% Native American 1%
- Hispanic origin (detail)
- Mexican 8%
- Common ancestry
- Italian 21% Slovak 2% Serbian 1%
- Foreign-born
- 5% · Canada
- Languages at home
- 92% English-only · Spanish 8%
Political lean MEDSL · Eastland
- 2024 margin
- Solid R (+77.5) · D 11.0% · R 88.5%
- 2008→2024 swing
- -17.6pp toward R · 2008: -59.8pp · 2024: -77.5pp
- All cycles
- 2024: R+77.5 2020: R+75.4 2016: R+75.4 2012: R+68.9 2008: R+59.8
Not yet ingested
- Civics
- —
Market trends
- HPI YoY
- ▼ -52.60%
- Current HPI
- 190.0993
- Rent YoY
- —
- Metro
- —
- State GDP YoY
- ▲ 3.95%
- F500 in state
- 110
Industry mix (Fortune 500 HQ in TX)
| Industry | F500 HQs | Revenue |
|---|---|---|
| Energy | 16 | $1,198B |
|
||
| Technology | 5 | $198B |
|
||
| Engineering / Construction | 4 | $72B |
|
||
| Energy Services | 3 | $60B |
|
||
| Utilities | 3 | $41B |
|
||
| Healthcare | 2 | $330B |
|
||
Price history
+80.0% since first listed11 events — show timeline
- 2025-08-06 Listed $135,000 NTREIS
- 2023-05-05 Sold (MLS) — NTREIS
- 2023-05-02 Sold (Public Records) — Public Records
- 2023-05-02 Sold (Public Records) — Public Records
- 2023-03-29 Contingent — NTREIS
- 2023-03-28 Listed $125,000 NTREIS
- 2013-03-26 Sold (Public Records) — Public Records
- 2012-04-19 Listing Removed — NTREIS
- 2011-06-20 Listed $67,500 NTREIS
- 2010-12-02 Listing Removed — NTREIS
- 2010-06-01 Listed $75,000 NTREIS
Property tax history
+2.7%/yrLatest (2025): $1,892 · -0.3% YoY. Source: county tax records.
Cash-flow waterfall
monthlySold comps — $/sqft
last 12 mo · ≤1 miLoading sold comps…