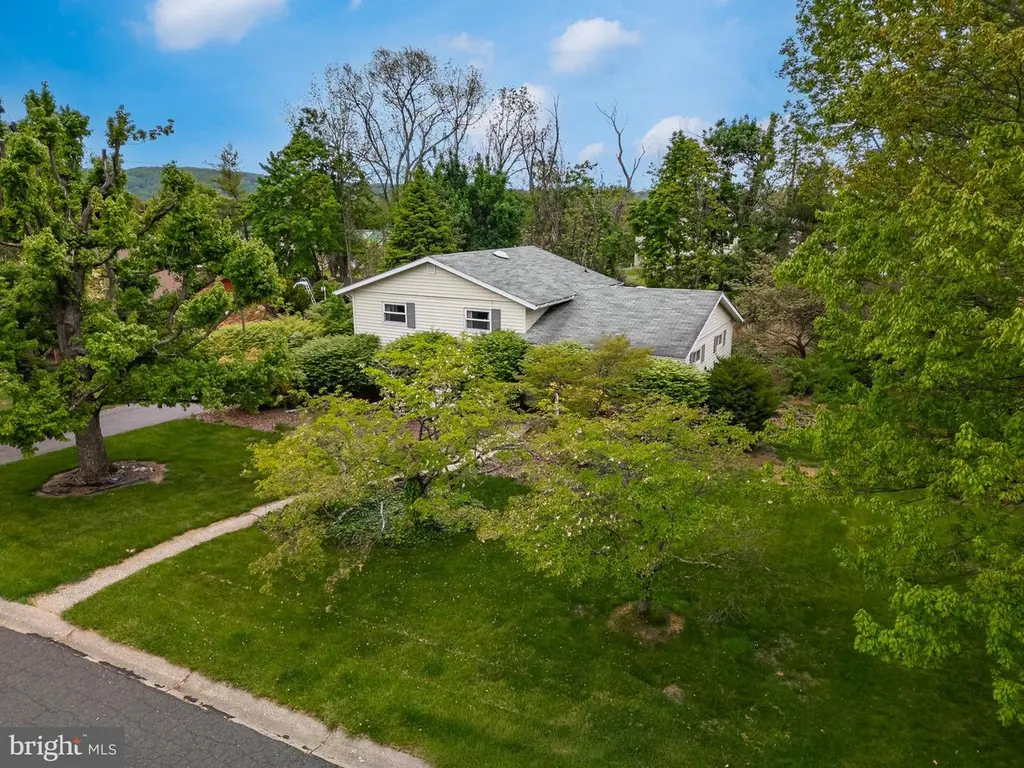
5131 Fairlawn Rd
Upper Saucon, PA 18034
$300,000C-
3 bd · 1.5 ba ·
1,518 sqft ·
Built 1967
· SingleFamily
· Pending
· 3 DOM
Cashflow @ list (25.0% down · 7.5%)
Estimated rent
$2,608/mo
Mortgage (P&I)
−$1,573
Tax + insurance
−$483
HOA
−$0
Vac / Maint / Mgmt
−$548
Net cashflow
$4/mo
Annual
$45/yr
Cap rate
6.31%
Cash-on-cash
0.05%
DSCR
1.00
1% rule
0.87%
Cash to close
$84,000
Investor read
- This is a 3-bed/1.5-bath single-family listed at $300k.
- At list price, monthly cash flow is $4 ($45/yr) — positive.
- The deal already cash-flows at list — no discount required.
- To meet the 1% rule (rent ≥ 1% of price), the offer needs to be $261k (13.1% below list).
- Only 3 days on market — expect competitive offers; lowballing is unlikely to land.
- Recommended offer: $261k (13.1% below list) — sets the bar for 1% rule.
- Local home prices are declining (-3.0%/yr); year-one equity from $2k of loan paydown is wiped out by about $9k of value loss. Plan a longer hold.
- Location reads: area grade C — affects rentability + tenant quality, not the cash-flow math above.
- Southern Lehigh SD (suburban): math 60% / reading 76% proficiency, ranked #25 of 539 in PA (top 5%) — acceptable for families but not a draw, mixed tenant base, ~2y average lease; only 10% free/reduced lunch — higher-income household profile.
- Zoned schools: Hopewell El Sch (math 82% / reading 87%, grade A+, #14 of 1,518 statewide, top 2%, 432 students, 10% FRL); Southern Lehigh Intermediate Sch (math 55% / reading 77%, grade A-, #23 of 512 statewide, top 4%, 692 students, 16% FRL); Southern Lehigh Shs (math 77%, 1,056 students, 13% FRL) — zoned schools at 13% FRL track the district average.
- Market conditions: 28 active listings in the ZIP; 5 comparable units currently listed for rent nearby; rentals at typical pace (median 21d on market — plan ~3-4 weeks tenant-placement turnaround); 765 units permitted in Lehigh County in 2024 (286 in 5+ unit buildings).
- Lehigh County population projected at +21% by 2050 — long-run rental-demand tailwind backs the buy-and-hold thesis.
- 2 sale attempts with the ask held roughly flat each time — persistent listings suggest the price (not the market) is what's stuck; bring a comps-based counter.
- Climate carrying-cost: extreme-heat days projected 7→15/yr by 2055 (HVAC capex compounding) — expect insurance premiums to compound above CPI over the hold.
Questions for listing agent
- Built in 1967 — when were the roof, HVAC, electrical panel, plumbing, and water heater last replaced?
- Is there a deadline driving the sale (1031 exchange, divorce, estate, relocation)? That informs how much negotiation room exists.
- What's the average days-on-market for RENTAL listings here right now (not sales)? A rising rental-DOM trend means longer vacancies and softer asking-rent achievability than the comps imply.
- What's the recent tenant-quality profile in this submarket — average credit score on applications, eviction rate, late-payment / NSF rate, and stable-employment percentage? A property-management company in the area should have these aggregated.
- How much new for-sale + rental construction is in the pipeline within 1–3 miles? Heavy new supply typically softens prices + rents 12–24 months out; constrained supply supports both.
CashFlowRE · CFR-M17N0M8XEZVT61
· Data 2 weeks ago
cashflowre.app · 2026-05-29