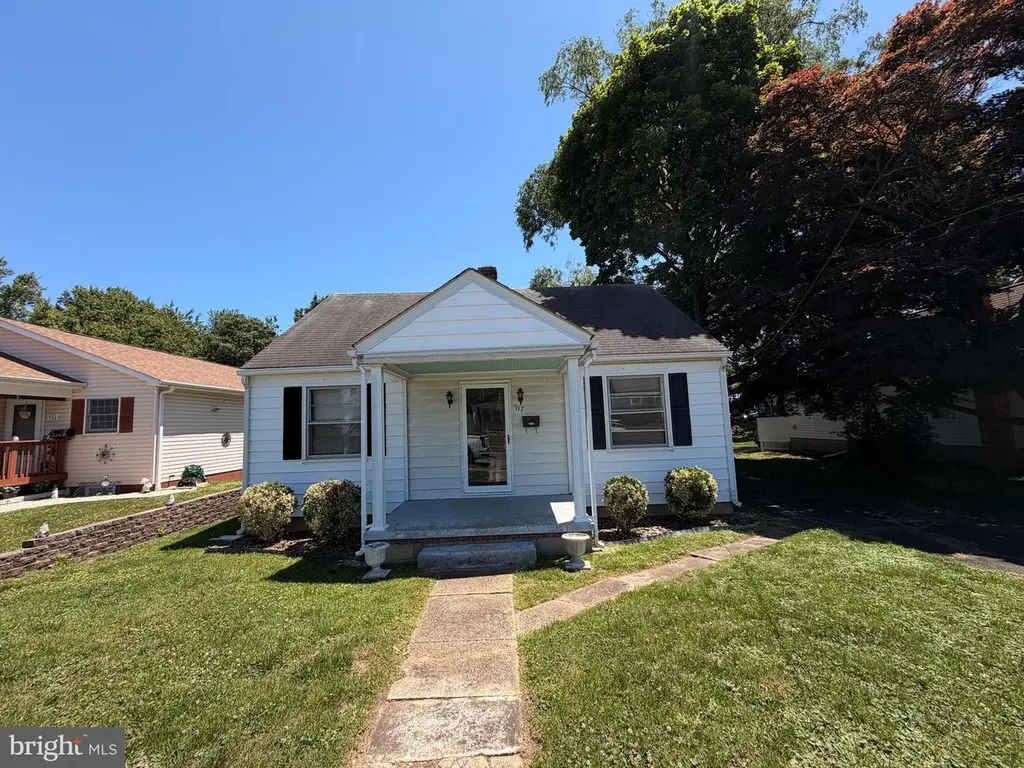
917 S Bradford St
Dover, DE 19904
$220,000F
2 bd · 1.0 ba ·
844 sqft ·
Built 1950
· SingleFamily
· Active
· 14 DOM
Cashflow @ list (25.0% down · 7.5%)
Estimated rent
$1,698/mo
Mortgage (P&I)
−$1,154
Tax + insurance
−$207
HOA
−$0
Vac / Maint / Mgmt
−$357
Net cashflow
$-19/mo
Annual
$-230/yr
Cap rate
6.19%
Cash-on-cash
-0.37%
DSCR
0.98
1% rule
0.77%
Cash to close
$61,600
Investor read
- This is a 2-bed/1.0-bath single-family listed at $220k.
- At list price, monthly cash flow is $-19 ($-230/yr) — negative.
- To cash-flow at today's rent, offer at most $217k (1.5% below list).
- To meet the 1% rule (rent ≥ 1% of price), the offer needs to be $170k (22.8% below list).
- Only 14 days on market — expect competitive offers; lowballing is unlikely to land.
- Recommended offer: $170k (22.8% below list) — sets the bar for 1% rule.
- Local home prices are declining (-3.0%/yr); year-one equity from $2k of loan paydown is wiped out by about $7k of value loss. Plan a longer hold.
- Location reads 67/100 on livability (#38 in DE) — a middle-class / working-renter tenant base. Strengths: amenities A+, cost of living A+, housing A+; Watch: crime F, commute F, employment D-.
- Capital School District (urban): math 14% / reading 31% proficiency, ranked #24 of 26 in DE (top 92%) — low school quality limits family demand, transient renter base, plan for 1-2y turnover.
- Zoned schools: South Dover Elementary School (math 12% / reading 27%, grade F, #78 of 105 statewide, top 78%, 610 students, 0% FRL); Central Middle School (math 12% / reading 31%, grade F, #27 of 36 statewide, top 77%, 860 students, 0% FRL); Dover High School (math 21% / reading 45%, grade F, #22 of 40 statewide, top 56%, 1,771 students, 0% FRL) — zoned schools average 0% FRL vs 56% district-wide (56 pts lower); this property's tenant base skews higher-income than the district average.
- Watch-outs: built in 1950 — expect roof / HVAC / electrical / plumbing capex.
- Market conditions: Rents rising (+3.3%/yr); 231 active listings in the ZIP; 9 comparable units currently listed for rent nearby; rentals lingering (median 46d on market — plan ~5-8 weeks vacancy on turnover, expect pricing pressure); 100% of comp listings sitting > 30 days — soft ceiling on asking rent; 1,201 units permitted in Kent County in 2024 (116 in 5+ unit buildings).
- Kent County population projected at +22% by 2050 — long-run rental-demand tailwind backs the buy-and-hold thesis.
- 3 sale attempts since 26y ago with the ask held roughly flat each time — persistent listings suggest the price (not the market) is what's stuck; bring a comps-based counter.
- Current owner paid $99k; list at $220k implies a 123% gain — meaningful room to come down on a strong offer.
- Climate carrying-cost: major wind risk, 78% chance of damaging wind over 30y; extreme-heat days projected 7→16/yr by 2055 (HVAC capex compounding) — expect insurance premiums to compound above CPI over the hold.
- This rent runs 30% of the median local income ($67k/yr) — at the standard rent-burdened threshold; future hikes will face affordability resistance.
Questions for listing agent
- What do current leases actually rent for vs. the listed asking? Can we see a recent rent roll and the last 12 months of T-12 income?
- Built in 1950 — when were the roof, HVAC, electrical panel, plumbing, and water heater last replaced?
- Is there a deadline driving the sale (1031 exchange, divorce, estate, relocation)? That informs how much negotiation room exists.
- Crime grade is F in this area — have there been break-ins, vandalism, or insurance claims at this property in the last 3 years? What carrier currently insures it and at what premium?
- The area grade is low — what's the realistic commute time and amenity access for the typical tenant pool here? Any planned neighborhood developments (good or bad) we should know about?
- What's the average days-on-market for RENTAL listings here right now (not sales)? A rising rental-DOM trend means longer vacancies and softer asking-rent achievability than the comps imply.
- What's the recent tenant-quality profile in this submarket — average credit score on applications, eviction rate, late-payment / NSF rate, and stable-employment percentage? A property-management company in the area should have these aggregated.
- How much new for-sale + rental construction is in the pipeline within 1–3 miles? Heavy new supply typically softens prices + rents 12–24 months out; constrained supply supports both.
CashFlowRE · CFR-M1H7YM1WK5J7N8
· Data 3 h ago
cashflowre.app · 2026-05-29