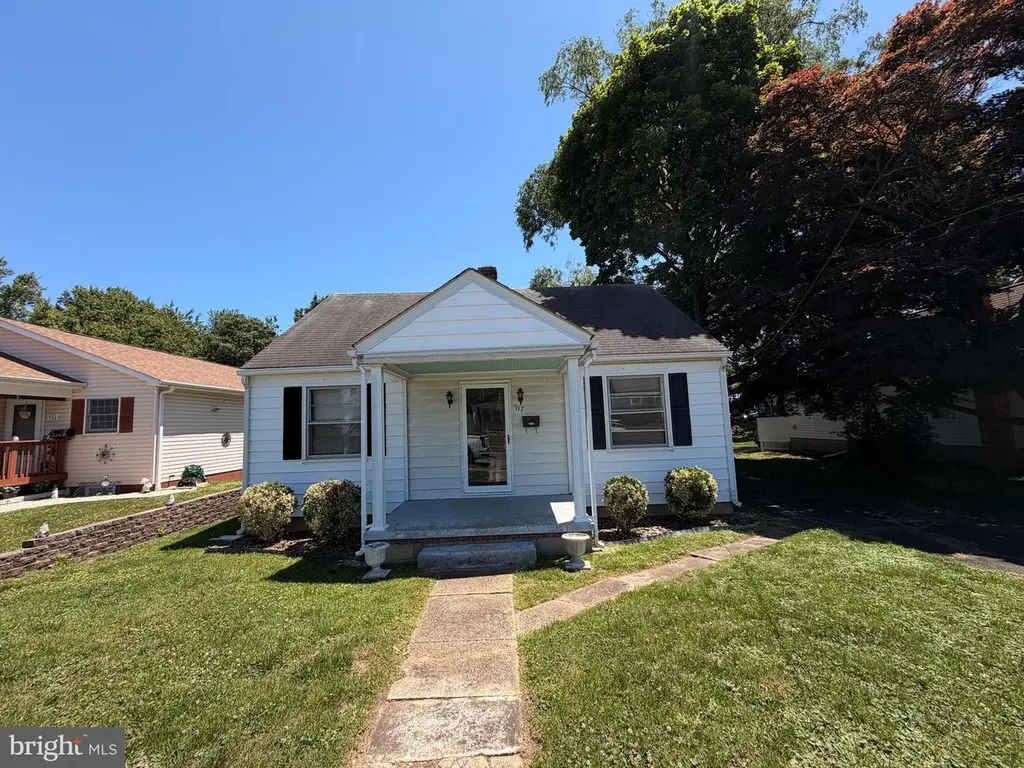
917 S Bradford St · Dover, DE
Flood risk 1/10 · Minimal
- FEMA flood zone
- X (unshaded)
- Chance of flooding over 30 yrs
- 0.0%
- Est. flood insurance / yr
- $473 – $860
Fire risk 1/10 · Minimal
- Est. fire insurance / yr
- $476 – $884
Heat risk 8/10 · Major
- Hot days now (above 102°F)
- 7 days/yr
- Hot days in 30 yrs
- 16 days/yr
Wind risk 7/10 · Major
- Chance of severe wind over 30 yrs
- 78.0%
Air-quality risk 2/10 · Minimal
- Unhealthy air days now
- 1 days/yr
- Unhealthy air days in 30 yrs
- 2 days/yr
Risk factors via First Street. Map © Google.
Why this score? — see what drove the F grade
The composite is a weighted blend of 9 inputs, each scored 0–100. Each bar is that input's sub-score; the figure is the points it added to the 100-point composite (weight × sub-score).
- Cash flow +12.8/30.0
- ARV discount +4.2/15.0
- DSCR +3.8/10.0
- Livability +3.4/5.0
- Rent growth +3.3/5.0
- 1% rule +2.7/10.0
- Condition / age +2.5/5.0
- Schools +2.0/10.0
- Appreciation +0.0/10.0
$220,000
🖨 Deal sheet (PDF) 📄 Offer letter ✓ Due diligence
Listing remarks MLS
New Carpet, New Vinyl, New Paint, Newly finished room on second floor that could be used as a third bedroom.
Key facts
- Expansive yard
- Full basement
- Walk-up attic
Tags
Property features AI
Exterior
- Parking: Detached front-entry garage with 2 spaces
- Utilities: Public water; Public sewer
- Home design: Detached single-family property; Year built reported by assessor
- Construction: Stick-built construction; Concrete perimeter foundation; Above- and below-grade structures
- Exterior features: Lot dimensions approximately 50 x 180
Interior
- Bedrooms: 2 bedrooms on the main level
- Bathrooms: 1 full bathroom (main level)
- Heating & cooling: Baseboard electric heating; Central heating; Window air conditioning units; Oil heating fuel; Electric hot water
- Interior features: Full unfinished basement; Multiple access exits
Neighborhood map
What this means for you Summary
Snapshot
- This is a 2-bed/1.0-bath single-family listed at $220k.
Deal economics
- At list price, monthly cash flow is $-19 ($-230/yr) — negative.
- To cash-flow at today's rent, offer at most $217k (1.5% below list).
- To meet the 1% rule (rent ≥ 1% of price), the offer needs to be $170k (22.8% below list).
- Recommended offer: $170k (22.8% below list) — sets the bar for 1% rule.
Location & tenants
- Location reads 67/100 on livability (#38 in DE) — a middle-class / working-renter tenant base. Strengths: amenities A+, cost of living A+, housing A+; Watch: crime F, commute F, employment D-.
- Capital School District (urban): math 14% / reading 31% proficiency, ranked #24 of 26 in DE (top 92%) — low school quality limits family demand, transient renter base, plan for 1-2y turnover.
- Zoned schools: South Dover Elementary School (math 12% / reading 27%, grade F, #78 of 105 statewide, top 78%, 610 students, 0% FRL); Central Middle School (math 12% / reading 31%, grade F, #27 of 36 statewide, top 77%, 860 students, 0% FRL); Dover High School (math 21% / reading 45%, grade F, #22 of 40 statewide, top 56%, 1,771 students, 0% FRL) — zoned schools average 0% FRL vs 56% district-wide (56 pts lower); this property's tenant base skews higher-income than the district average.
- Market conditions: Rents rising (+3.3%/yr); 231 active listings in the ZIP; 9 comparable units currently listed for rent nearby; rentals lingering (median 45d on market — plan ~5-8 weeks vacancy on turnover, expect pricing pressure); 100% of comp listings sitting > 30 days — soft ceiling on asking rent; 1,201 units permitted in Kent County in 2024 (116 in 5+ unit buildings).
- This rent runs 30% of the median local income ($67k/yr) — at the standard rent-burdened threshold; future hikes will face affordability resistance.
Forward outlook
- Local home prices are declining (-3.0%/yr); year-one equity from $2k of loan paydown is wiped out by about $7k of value loss. Plan a longer hold.
- Kent County population projected at +22% by 2050 — long-run rental-demand tailwind backs the buy-and-hold thesis.
Negotiation context
- Only 14 days on market — expect competitive offers; lowballing is unlikely to land.
- 3 sale attempts since 26y ago with the ask held roughly flat each time — persistent listings suggest the price (not the market) is what's stuck; bring a comps-based counter.
- Current owner paid $99k; list at $220k implies a 123% gain — meaningful room to come down on a strong offer.
Risks & watch-outs
- Watch-outs: built in 1950 — expect roof / HVAC / electrical / plumbing capex.
- Climate carrying-cost: major wind risk, 78% chance of damaging wind over 30y; extreme-heat days projected 7→16/yr by 2055 (HVAC capex compounding) — expect insurance premiums to compound above CPI over the hold.
Questions for the listing agent
- What do current leases actually rent for vs. the listed asking? Can we see a recent rent roll and the last 12 months of T-12 income?
- Built in 1950 — when were the roof, HVAC, electrical panel, plumbing, and water heater last replaced?
- Is there a deadline driving the sale (1031 exchange, divorce, estate, relocation)? That informs how much negotiation room exists.
- Crime grade is F in this area — have there been break-ins, vandalism, or insurance claims at this property in the last 3 years? What carrier currently insures it and at what premium?
- The area grade is low — what's the realistic commute time and amenity access for the typical tenant pool here? Any planned neighborhood developments (good or bad) we should know about?
- What's the average days-on-market for RENTAL listings here right now (not sales)? A rising rental-DOM trend means longer vacancies and softer asking-rent achievability than the comps imply.
- What's the recent tenant-quality profile in this submarket — average credit score on applications, eviction rate, late-payment / NSF rate, and stable-employment percentage? A property-management company in the area should have these aggregated.
- How much new for-sale + rental construction is in the pipeline within 1–3 miles? Heavy new supply typically softens prices + rents 12–24 months out; constrained supply supports both.
Investment metrics
- 1% rule
- 0.77% ✗
- Cap rate
- 6.19%
- Cash-on-cash
- -0.37%
- DSCR
- 0.98
- GRM
- 10.8
CMA / ARV
- ARV (on-the-fly)
- $205,092
- Comps found
- 6
Show comp detail 6 sales within ~0.75 mi
| Address | Dist | Beds/Ba | Sqft | Sold | Price | $/sf | Match |
|---|---|---|---|---|---|---|---|
| 234 Pine St | 0.35mi | 2/1.0 | 897 (+6%) | 2mo | $240,000 | $268 | 72 |
| 624 River Rd | 0.52mi | 3/1.0 (+1) | 925 (+10%) | 6mo | $225,000 | $243 | 50 |
| 745 River Rd | 0.54mi | 3/1.0 (+1) | 925 (+10%) | 10mo | $212,500 | $230 | 45 |
| 430 Collins Dr | 0.57mi | 3/1.0 (+1) | 950 (+13%) | 5mo | $164,900 | $174 | 44 |
| 1018 Monroe Ter | 0.38mi | 2/1.0 | 967 (+15%) | 19mo | $270,000 | $279 | 42 |
| 433 Collins Dr | 0.59mi | 3/1.0 (+1) | 950 (+13%) | 17mo | $155,000 | $163 | 32 |
Match score weights: distance 35% · size 25% · config 20% · recency 20%. Top-matched comps best support the ARV.
Projected returns pro-forma
-3.0% appreciation · 3.3% rent growth · sell at horizon
- IRR
- -16.7%
- Equity multiple
- 0.41×
- Total profit
- $-36,431
- Equity at exit
- $32,803
- IRR
- -8.1%
- Equity multiple
- 0.49×
- Total profit
- $-31,472
- Equity at exit
- $19,022
Cash invested: $61,600 (down + closing). Projections, not guarantees.
Landlord ↔ Tenant lean methodology
- Overall (STATE)
- 70 Landlord-Friendly
- State Delaware
- 70 Landlord-Friendly · D+7
- County
- — inherits STATE
- City
- — inherits STATE
ZIP-level market 19904
- Rents YoY
- 3.3%
- Active inventory
- 231
- Price-to-rent
- 10.8×
Monthly cashflow live
- Estimated rent
- $1,698 high interval (Pro) →
- Mortgage (P&I)
- −$1,154
- Tax from tax record
- −$115 /mo · $1,380/yr
- Insurance
- −$92
- HOA
- −$0
- Vacancy / Maint / Mgmt
- −$357
- Net cashflow
- $-19
Break-even live
Sensitivity live
| Price | -10% $105 | -5% $43 | +0% $-19 | +5% $-81 | +10% $-144 |
|---|---|---|---|---|---|
| Rent | -10% $-153 | -5% $-86 | +0% $-19 | +5% $48 | +10% $115 |
| Rate | -1.0pp $92 | -0.5pp $37 | base $-19 | +0.5pp $-76 | +1.0pp $-134 |
UW: 25.0% down · 7.5% · 30yr · 1.5% tax · 5.0% vac · 8.0% maint · 8.0% mgmt
Financing live
Cash to close
- Down payment
- $55,000
- Closing costs
- $6,600
- Reserves months
- —
- Total cash needed
- —
Loan-product check · same deal, 3 products live
Conventional
25% down · 7.5% · 30yr
- Down + closing
- —
- Monthly P&I
- —
- Monthly cashflow
- —
- DSCR
- —
- Eligible?
- —
Personal DTI + credit; lowest rate.
DSCR
20% down · 8.5% · 30yr
- Down + closing
- —
- Monthly P&I
- —
- Monthly cashflow
- —
- DSCR
- —
- Eligible?
- —
No personal income docs; deal must DSCR.
Hard money
10% down · 12.0% · 12mo
- Down + closing
- —
- Monthly P&I
- —
- Monthly cashflow
- —
- DSCR
- —
- Eligible?
- —
Short-term bridge; refi at stabilization.
Rent comps 9 comps
| Address | Beds | Baths | Sqft | Rent | $/sqft | DOM | Units | Dist |
|---|---|---|---|---|---|---|---|---|
| 814 New Castle Ave Dover, DE | 3.0 | 1.0 | 950 | $1,650 | $1.74 | 45d | 1 | 0.59mi |
| 16 S New St #1 Dover, DE | 3.0 | 1.0 | 1000 | $1,950 | $1.95 | 45d | 1 | 0.90mi |
| 46 Lincoln St Dover, DE | 2.0 | 2.0 | 1073 | $1,700 | $1.58 | 45d | 1 | 0.91mi |
| 12 S State St Unit 2 Dover, DE | 1.0 | 1.0 | 800 | $1,195 | $1.49 | 45d | 1 | 0.92mi |
| 5 S State St Dover, DE | 1.0 | 1.5 | 1100 | $1,200 | $1.09 | 45d | 1 | 0.94mi |
| 51 Webbs Ln Dover, DE | 2.0 | 1.0–1.5 | 787 | $1,525 | $1.94 | 45d | 11 | 1.03mi |
| 355A Ridgely St Dover, DE | 1.0–3.0 | 1.0–2.5 | 1238 | $2,210 | $1.78 | 45d | 17 | 1.04mi |
| 480 Country Dr Dover, DE | 3.0 | 1.0–2.0 | 715 | $1,653 | $2.31 | 45d | 22 | 1.27mi |
| 4 Carolee Dr Dover, DE | 3.0 | 1.0 | 1008 | $2,100 | $2.08 | 45d | 1 | 1.31mi |
Listing history 12 events
-
2026-06-22days on market $220,000 Active 14 DOM
-
2026-06-19days on market $220,000 Active 12 DOM
-
2026-06-18days on market $220,000 Active 11 DOM
-
2026-06-17days on market $220,000 Active 10 DOM
-
2026-06-16days on market $220,000 Active 9 DOM
-
2026-06-15days on market $220,000 Active 8 DOM
-
2026-06-14days on market $220,000 Active 6 DOM
-
2026-06-13days on market $220,000 Active 5 DOM
-
2026-06-10days on market $220,000 Active 3 DOM
-
2026-06-09days on market $220,000 Active 2 DOM
-
2026-06-07remarks 699-char remark
-
2026-06-07$220,000 Active 1 DOM
ⓘ Source: listings_history table (triggers on properties + properties_extension) + one-shot
backfill from property_details.listing_events for pre-trigger history.
Tax reassessment forecast DE · Partial reset (capped growth)
- Current annual tax
- $1,380 · $115/mo
- Projected year-2 tax
- $1,380 · $115/mo
- Expected delta
- $0/yr ($0/mo · 0.0%)
ⓘ Screening estimate from a state-policy table — verify with the county assessor before closing.
Climate risk First Street
- Flood 1/10 Low FEMA zone X (unshaded) · 0% chance over 30 yrs
- Wildfire 1/10 Low
- Heat 8/10 Severe 7 d/yr ≥102°F today · 16 d/yr by 30 yrs out
- Wind 7/10 Severe 78% chance of damaging wind over 30 yrs
- Air quality 2/10 Low 1 unhealthy d/yr today · 2 by 30 yrs out
Nearby sold comps map
Loading sold comps map…
Walkable amenities ~0.75 mi
Loading nearby amenities…
Taxation est. · year 1
- Rental income
- $20,372
- − Mortgage interest
- −$12,323
- − Property taxes
- −$1,380
- − Insurance
- −$1,100
- − Repairs & maintenance
- −$1,630
- − Management
- −$1,630
- − Depreciation
- −$6,400
- Taxable loss
- −$4,091
- Est. tax savings @ 24.0%
- +$982
- After-tax cash flow
- $751/yr
For passive investors: Depreciation is non-cash, so a rental often shows a tax loss while cash-flowing — sheltering income. Rental losses are passive: they offset passive income freely, and up to $25,000/yr can offset ordinary (W-2) income if you actively participate and your MAGI is under $100k (phasing out to $0 by $150k); unused losses carry forward. On sale, claimed depreciation is recaptured at up to 25%, and gains may owe capital-gains tax (a 1031 exchange can defer both). Figures are a year-1 estimate at your 24.0% rate — not tax advice; consult a CPA.
Schools (NCES district)
- District
- Capital School District
- NCES district ID
- 1000190
- Math proficiency
- 14% ▼ -17.00%
- Reading proficiency
- 31% ▼ -12.00%
- Median HH income
- $48,499
- Composite
- 19.78/100
- National rank
- #8703
- State rank
- #24 of 26 in DE
Livability — Dover
- Score
- 67/100
- State rank
- #38
- US rank
- #10574
Category grades
Schools grade is shown separately in the Schools card above.
Census & demographics
- Census place
- Dover, DE
- County
- Kent County · 82,184 people
- City population
- 76,581
- Metro
- Dover, DE
- Population (ZIP)
- 38,818
- Household income
- $66,908
- Rent vs Own
- Severe rent burden
- 1500.0
Population outlook (Kent County) Hauer SSP2
- Today (2025)
- 194,477 people
- By 2030
- 204,351 · +5.1%
- By 2040
- 222,135 · +14.2%
- By 2050
- 236,483 · +21.6%
- By 2075
- 266,327 · +36.9%
- By 2100
- 275,335 · +41.6%
Race, ethnicity, and origin ACS 2023
- Neighborhood character
- Diverse neighborhood (Simpson 0.64)
- Race & ethnicity
- White 48% Black 35% Two or more races 9% Hispanic / Latino 8% Asian 3%
- Hispanic origin (detail)
- Mexican 1% Puerto Rican 4%
- Common ancestry
- Hispanic 3% Romanian 2% Slovak 2%
- Foreign-born
- 10% · Canada, South Korea
- Languages at home
- 87% English-only · Spanish 5% French/Haitian/Cajun 3% German/W. Germanic 1%
Political lean MEDSL · Kent
- 2024 margin
- Toss-up / Even · D 50.2% · R 48.2% · Other 1.7%
- 2008→2024 swing
- -7.8pp toward R · 2008: 9.8pp · 2024: 2.0pp
- All cycles
- 2024: D+2.0 2020: D+4.1 2016: R+4.9 2012: D+4.9 2008: D+9.8
Not yet ingested
- Civics
- —
Market trends
- HPI YoY
- ▼ -112.03%
- Current HPI
- 187.6879
- Rent YoY
- ▲ 3.30%
- Metro
- Dover, DE
- State GDP YoY
- —
- F500 in state
- 0
Price history
+214.3% since first listed9 events — show timeline
- 2026-06-07 Listed $220,000 BRIGHT MLS
- 2002-08-16 Sold (Public Records) $98,700 Public Records
- 2002-06-27 Sold (MLS) $98,700 BRIGHT MLS
- 2002-03-19 Listing Removed — BRIGHT MLS
- 2002-02-15 Listed $98,700 BRIGHT MLS
- 2000-11-14 Sold (Public Records) $70,000 Public Records
- 2000-11-13 Sold (MLS) $70,000 BRIGHT MLS
- 2000-10-30 Listing Removed — BRIGHT MLS
- 2000-09-01 Listed $70,000 BRIGHT MLS
Property tax history
+6.0%/yrLatest (2025): $1,380 · +3.5% YoY. Source: county tax records.
Cash-flow waterfall
monthlySold comps — $/sqft
last 12 mo · ≤1 miLoading sold comps…