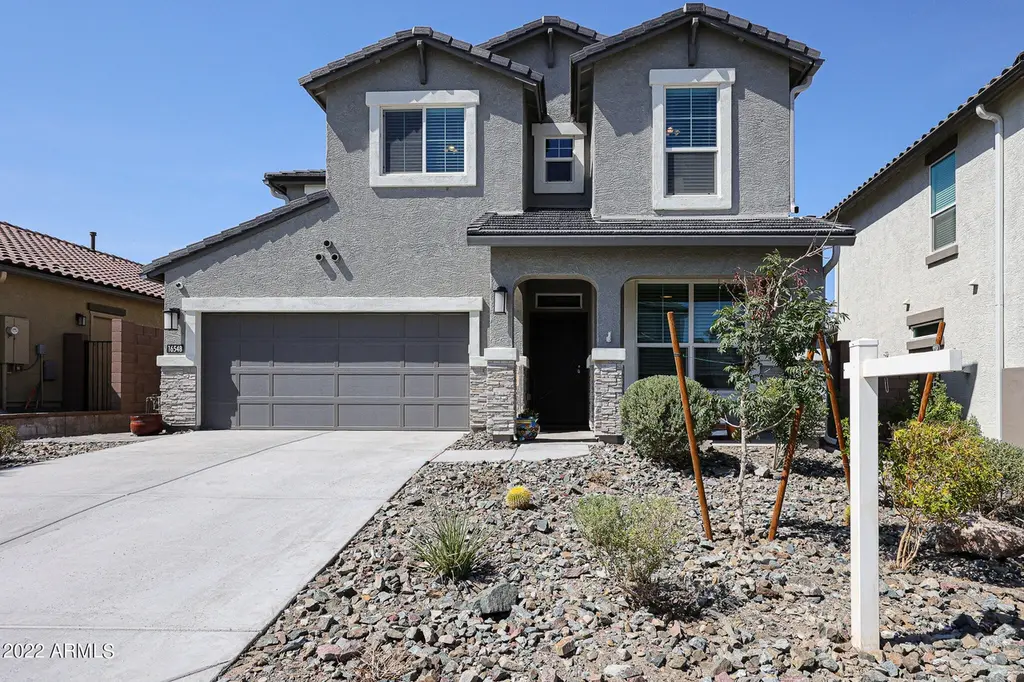
16548 W Winston Dr
Goodyear, AZ 85338
$1D+
4 bd · 3.0 ba ·
2,385 sqft ·
Built 2020
· SingleFamily
· Active
· 9 DOM
Cashflow @ list (25.0% down · 7.5%)
Estimated rent
$2,660/mo
Mortgage (P&I)
−$0
Tax + insurance
−$0
HOA
−$132
Vac / Maint / Mgmt
−$559
Net cashflow
$1,970/mo
Annual
$23,634/yr
Cap rate
2363429.68%
Cash-on-cash
8440797.81%
DSCR
375569.01
1% rule
266016.00%
Cash to close
$0
Investor read
- This is a 4-bed/3.0-bath single-family listed at $1. Condition is rated good.
- At list price, monthly cash flow is $2k ($24k/yr) — positive.
- The deal already cash-flows at list — no discount required.
- Meets the 1% rule at list price ($3k rent vs $1).
- Only 9 days on market — expect competitive offers; lowballing is unlikely to land.
- Local home prices are declining (-3.0%/yr); year-one equity from $0 of loan paydown is wiped out by about $0 of value loss. Plan a longer hold.
- Location reads 76/100 on livability (#15 in AZ, #3,737 nationally) — a middle-class / working-renter tenant base. Strengths: employment A+, housing A+, crime B+; Watch: health & safety D+, cost of living D, amenities F.
- Liberty Elementary District (4266) (rural): math 26% / reading 33% proficiency, ranked #100 of 249 in AZ (top 40%) — low school quality limits family demand, transient renter base, plan for 1-2y turnover.
- Zoned schools: Estrella Mountain Elementary School (math 31% / reading 37%, grade F, #490 of 1,109 statewide, top 45%, 533 students, 27% FRL).
- Market conditions: Rents soft (-0.7%/yr); 1088 active listings in the ZIP; 5 comparable units currently listed for rent nearby; rentals leasing fast (median 1d on market — plan ~1-2 weeks tenant-placement turnaround); solid renter incomes; 36,011 units permitted in Maricopa County in 2024 (12,801 in 5+ unit buildings).
- Maricopa County population projected at +38% by 2050 — long-run rental-demand tailwind backs the buy-and-hold thesis.
- 4 sale attempts since 4y ago with the ask held roughly flat each time — persistent listings suggest the price (not the market) is what's stuck; bring a comps-based counter.
- At projected returns (-3.0% appreciation + 0.0% rent growth), your $0 cash investment doubles in ~1 year — after that, you're playing with house money.
- Climate carrying-cost: moderate wildfire risk; extreme-heat days projected 7→19/yr by 2055 (HVAC capex compounding) — expect insurance premiums to compound above CPI over the hold.
- Cap rate 2363429.7% vs local median 3.0% in Goodyear — top-decile yield for the area; either an underpriced asset or a hidden risk that comps aren't pricing in. Stress-test before assuming the spread holds.
- This rent runs 31% of the median local income ($102k/yr) — at the standard rent-burdened threshold; future hikes will face affordability resistance.
Questions for listing agent
- What does the HOA fee cover, when was the last increase, and are there any pending special assessments or reserve-fund shortfalls?
- Is there a deadline driving the sale (1031 exchange, divorce, estate, relocation)? That informs how much negotiation room exists.
- Schools are B-rated — typically a magnet for longer-tenancy family renters. What's the average tenant stay here, and is there a school-zone premium baked into asking?
- The area grade is low — what's the realistic commute time and amenity access for the typical tenant pool here? Any planned neighborhood developments (good or bad) we should know about?
- What's the average days-on-market for RENTAL listings here right now (not sales)? A rising rental-DOM trend means longer vacancies and softer asking-rent achievability than the comps imply.
- What's the recent tenant-quality profile in this submarket — average credit score on applications, eviction rate, late-payment / NSF rate, and stable-employment percentage? A property-management company in the area should have these aggregated.
- How much new for-sale + rental construction is in the pipeline within 1–3 miles? Heavy new supply typically softens prices + rents 12–24 months out; constrained supply supports both.
CashFlowRE · CFR-M1JCJZD9ES22FD
· Data 2 days ago
cashflowre.app · 2026-05-29