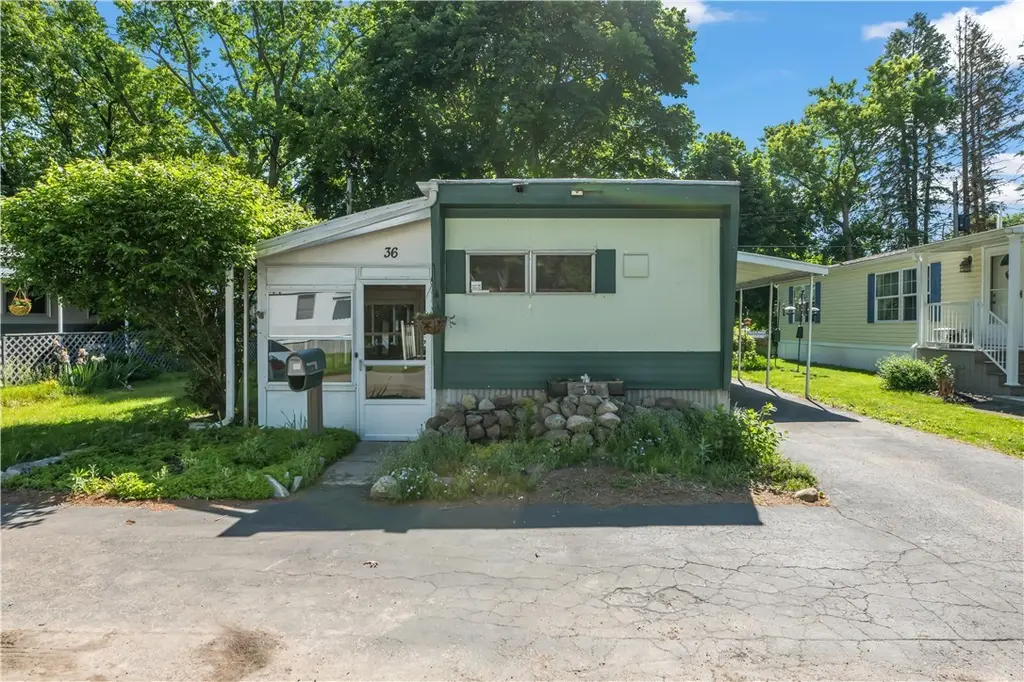
36 Patio Dr
St. John Fisher College, NY 14625
$49,900B-
2 bd · 1.0 ba ·
720 sqft ·
Built 1969
· Manufactured
· Pending
· 16 DOM
Cashflow @ list (25.0% down · 7.5%)
Estimated rent
$1,418/mo
Mortgage (P&I)
−$262
Tax + insurance
−$83
HOA
−$0
Vac / Maint / Mgmt
−$298
Net cashflow
$775/mo
Annual
$9,306/yr
Cap rate
24.94%
Cash-on-cash
66.60%
DSCR
3.96
1% rule
2.84%
Cash to close
$13,972
Investor read
- This is a 2-bed/1.0-bath manufactured listed at $50k. Condition is rated fair.
- At list price, monthly cash flow is $775 ($9k/yr) — positive.
- The deal already cash-flows at list — no discount required.
- Meets the 1% rule at list price ($1k rent vs $50k).
- It's been on market 16 days — a 2% lower offer ($49k) is reasonable based on typical stale-listing flexibility.
- Recommended offer: $49k (1.5% below list) — sets the bar for market timing.
- Local home prices are declining (-3.0%/yr); year-one equity from $345 of loan paydown is wiped out by about $1k of value loss. Plan a longer hold.
- Location reads: area grade B — affects rentability + tenant quality, not the cash-flow math above.
- Penfield Central School District (suburban): math 77% / reading 79% proficiency, ranked #67 of 590 in NY (top 11%) — strong family-tenant draw, lease renewals of 3-5y typical; only 11% free/reduced lunch — higher-income household profile.
- Market conditions: 63 active listings in the ZIP; 4 comparable units currently listed for rent nearby; rentals at typical pace (median 21d on market — plan ~3-4 weeks tenant-placement turnaround); 1,169 units permitted in Monroe County in 2024 (591 in 5+ unit buildings).
- Monroe County population projected to shrink 6% by 2050 — rents likely to lag national; underwrite the cash flow, not the appreciation.
- 4 sale attempts with the ask held roughly flat each time — persistent listings suggest the price (not the market) is what's stuck; bring a comps-based counter.
- Current owner paid $20k; list at $50k implies a 150% gain — meaningful room to come down on a strong offer.
- At projected returns (-3.0% appreciation + 3.0% rent growth), your $14k cash investment doubles in ~2 years — after that, you're playing with house money.
- Cap rate 24.9% vs local median 16.6% in St. John Fisher College — top-decile yield for the area; either an underpriced asset or a hidden risk that comps aren't pricing in. Stress-test before assuming the spread holds.
Questions for listing agent
- Have any recent inspections been done? Can we get a copy of the seller's disclosures and any deferred-maintenance estimates?
- Built in 1969 — when were the roof, HVAC, electrical panel, plumbing, and water heater last replaced?
- Is there a deadline driving the sale (1031 exchange, divorce, estate, relocation)? That informs how much negotiation room exists.
- What's the average days-on-market for RENTAL listings here right now (not sales)? A rising rental-DOM trend means longer vacancies and softer asking-rent achievability than the comps imply.
- What's the recent tenant-quality profile in this submarket — average credit score on applications, eviction rate, late-payment / NSF rate, and stable-employment percentage? A property-management company in the area should have these aggregated.
- How much new for-sale + rental construction is in the pipeline within 1–3 miles? Heavy new supply typically softens prices + rents 12–24 months out; constrained supply supports both.
CashFlowRE · CFR-M3PG3P9SVK30F9
· Data 1 day ago
cashflowre.app · 2026-05-29