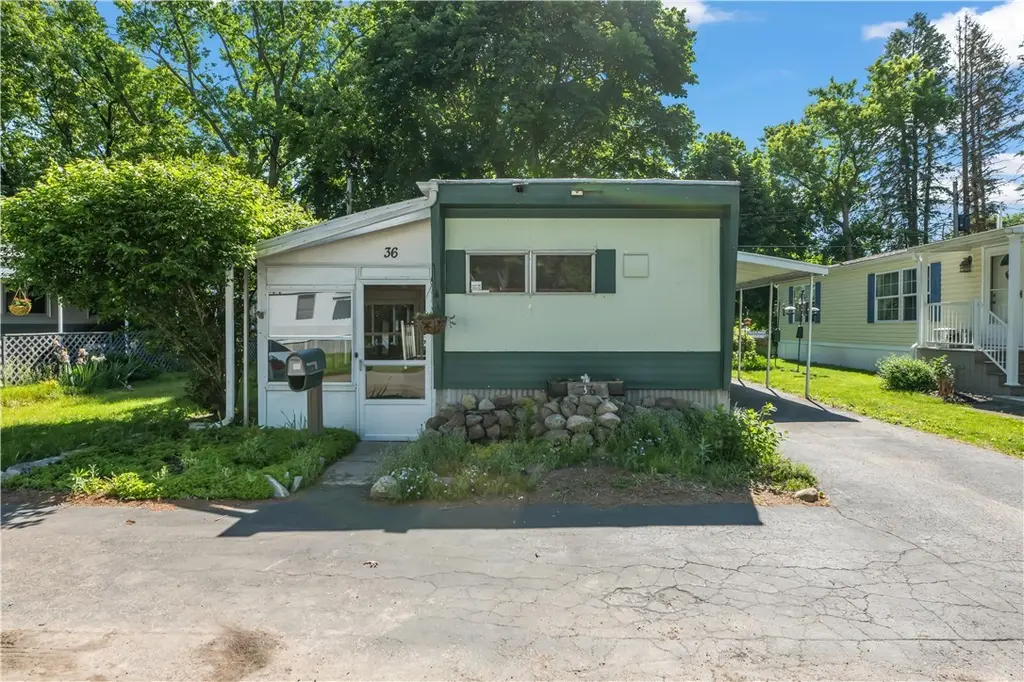
36 Patio Dr · St. John Fisher College, NY
Flood risk 1/10 · Minimal
- FEMA flood zone
- X (unshaded)
- Chance of flooding over 30 yrs
- 0.0%
- Est. flood insurance / yr
- $507 – $1,088
Fire risk 1/10 · Minimal
- Est. fire insurance / yr
- $691 – $1,283
Heat risk 2/10 · Minimal
- Hot days now (above 95°F)
- 7 days/yr
- Hot days in 30 yrs
- 15 days/yr
Wind risk 1/10 · Minimal
- Chance of severe wind over 30 yrs
- —
Air-quality risk 2/10 · Minimal
- Unhealthy air days now
- 1 days/yr
- Unhealthy air days in 30 yrs
- 2 days/yr
Risk factors via First Street. Map © Google.
Why this score? — see what drove the B- grade
The composite is a weighted blend of 9 inputs, each scored 0–100. Each bar is that input's sub-score; the figure is the points it added to the 100-point composite (weight × sub-score).
- Cash flow +30.0/30.0
- 1% rule +10.0/10.0
- DSCR +10.0/10.0
- Schools +6.8/10.0
- ARV discount +5.2/15.0
- Rent growth +2.5/5.0
- Livability +2.5/5.0
- Condition / age +2.2/5.0
- Appreciation +0.0/10.0
$49,900
🖨 Deal sheet 📄 Offer letter ✓ Due diligence
Listing remarks MLS
This spacious 2-bedroom, 1-bathroom mobile home in Penfield, NY offers comfortable and convenient living in a quiet, friendly neighborhood. The home features blown-in insulation for year-round energy efficiency, a recently recoated roof (2025), and a newer AC unit to keep things cool in the summer. Inside, you’ll find a well-designed layout with ample living space and plenty of storage throughout. Outside, enjoy a fully fenced yard with beautiful landscaping, perfect for relaxing or entertaining. Additional storage is available in exterior shed, porch, and covered spaces. The location is ideal—close to shopping, dining, schools, and major roadways while still offering a peaceful setting. This move-in ready home combines comfort, functionality, and great value in one appealing package for an affordable price! Subject to park approval.
Key facts
- Updated mobile home
- Granite countertops
- Tile backsplash
Tags
Property features AI
Finance
- Financial info: Land lease: $981
- HOA & community: Community playground
Exterior
- Parking: Carport
- Utilities: Electricity available and connected (circuit breakers); Public water connected; Sewer connected; High-speed internet available; Cable available
- Home design: Single-wide mobile home (Richardson); Single story; Existing condition
- Construction: Aluminum siding; Metal roof
- Exterior features: Blacktop driveway; Deck; Fully fenced yard; Rectangular residential lot; City street frontage
Interior
- Kitchen: Granite counters; Electric oven; Electric range; Microwave; Refrigerator
- Bedrooms: 2 main level bedrooms
- Flooring: Carpet; Varies
- Bathrooms: 1 full bathroom (main level)
- Heating & cooling: Forced air heating (propane); Wall unit cooling
- Interior features: Ceiling fan(s); Eat-in kitchen; Separate/formal living room; Granite counters; Thermal windows; Main level primary bedroom
- Laundry & utility: Washer and dryer on main level; Propane water heater
Neighborhood map
What this means for you Summary
Snapshot
- This is a 2-bed/1.0-bath manufactured listed at $50k. Condition is rated fair.
Deal economics
- At list price, monthly cash flow is $775 ($9k/yr) — positive.
- The deal already cash-flows at list — no discount required.
- Meets the 1% rule at list price ($1k rent vs $50k).
- Recommended offer: $49k (1.5% below list) — sets the bar for market timing.
- Cap rate 24.9% vs local median 16.6% in St. John Fisher College — top-decile yield for the area; either an underpriced asset or a hidden risk that comps aren't pricing in. Stress-test before assuming the spread holds.
Location & tenants
- Location reads: area grade B — affects rentability + tenant quality, not the cash-flow math above.
- Penfield Central School District (suburban): math 77% / reading 79% proficiency, ranked #67 of 590 in NY (top 11%) — strong family-tenant draw, lease renewals of 3-5y typical; only 11% free/reduced lunch — higher-income household profile.
- Market conditions: 63 active listings in the ZIP; 4 comparable units currently listed for rent nearby; rentals at typical pace (median 21d on market — plan ~3-4 weeks tenant-placement turnaround); 1,169 units permitted in Monroe County in 2024 (591 in 5+ unit buildings).
Forward outlook
- Local home prices are declining (-3.0%/yr); year-one equity from $345 of loan paydown is wiped out by about $1k of value loss. Plan a longer hold.
- Monroe County population projected to shrink 6% by 2050 — rents likely to lag national; underwrite the cash flow, not the appreciation.
- At projected returns (-3.0% appreciation + 3.0% rent growth), your $14k cash investment doubles in ~2 years — after that, you're playing with house money.
Negotiation context
- It's been on market 16 days — a 2% lower offer ($49k) is reasonable based on typical stale-listing flexibility.
- 4 sale attempts with the ask held roughly flat each time — persistent listings suggest the price (not the market) is what's stuck; bring a comps-based counter.
- Current owner paid $20k; list at $50k implies a 150% gain — meaningful room to come down on a strong offer.
Questions for the listing agent
- Have any recent inspections been done? Can we get a copy of the seller's disclosures and any deferred-maintenance estimates?
- Built in 1969 — when were the roof, HVAC, electrical panel, plumbing, and water heater last replaced?
- Is there a deadline driving the sale (1031 exchange, divorce, estate, relocation)? That informs how much negotiation room exists.
- What's the average days-on-market for RENTAL listings here right now (not sales)? A rising rental-DOM trend means longer vacancies and softer asking-rent achievability than the comps imply.
- What's the recent tenant-quality profile in this submarket — average credit score on applications, eviction rate, late-payment / NSF rate, and stable-employment percentage? A property-management company in the area should have these aggregated.
- How much new for-sale + rental construction is in the pipeline within 1–3 miles? Heavy new supply typically softens prices + rents 12–24 months out; constrained supply supports both.
Investment metrics
- 1% rule
- 2.84% ✓
- Cap rate
- 24.94%
- Cash-on-cash
- 66.60%
- DSCR
- 3.96
- GRM
- 2.9
CMA / ARV
- ARV (on-the-fly)
- $47,520
- Comps found
- 8
Show comp detail 8 sales within ~0.75 mi
| Address | Dist | Beds/Ba | Sqft | Sold | Price | $/sf | Match |
|---|---|---|---|---|---|---|---|
| 36 Patio Dr | 0.00mi | 2/1.0 | 720 (0%) | 3mo | $20,000 | $28 | 97 |
| 13 Starwood Dr | 0.19mi | 2/1.0 | 720 (0%) | 0mo | $64,900 | $90 | 91 |
| 40 Norhill Dr | 0.10mi | 2/1.5 | 732 (+2%) | 7mo | $60,000 | $82 | 85 |
| 3 Starwood Dr | 0.24mi | 2/1.0 | 720 (0%) | 8mo | $26,000 | $36 | 82 |
| 82 Gennis Dr | 0.19mi | 2/1.0 | 700 (-3%) | 18mo | $46,000 | $66 | 71 |
| 19 Elderberry Cir | 0.38mi | 2/1.0 | 720 (0%) | 18mo | $62,599 | $87 | 67 |
| 7 Skyview Dr | 0.14mi | 2/1.0 | 809 (+12%) | 8mo | $10,000 | $12 | 66 |
| 17 Sebastian Dr | 0.34mi | 2/2.0 | 824 (+14%) | 23mo | $45,000 | $55 | 37 |
Match score weights: distance 35% · size 25% · config 20% · recency 20%. Top-matched comps best support the ARV.
Projected returns pro-forma
-3.0% appreciation · 3.0% rent growth · sell at horizon
- IRR
- 65.9%
- Equity multiple
- 3.96×
- Total profit
- $41,325
- Equity at exit
- $7,440
- IRR
- 70.2%
- Equity multiple
- 8.13×
- Total profit
- $99,669
- Equity at exit
- $4,314
Cash invested: $13,972 (down + closing). Projections, not guarantees.
Landlord ↔ Tenant lean methodology
- Overall (STATE)
- 15 Strongly Tenant-Friendly
- State New York
- 15 Strongly Tenant-Friendly · D+10
- County
- — inherits STATE
- City
- — inherits STATE
ZIP-level market 14625
- Home prices YoY
- -15.3%
- Active inventory
- 63
- Price-to-rent
- 2.9×
Monthly cashflow live
- Estimated rent
- $1,418 medium interval (Pro) →
- Mortgage (P&I)
- −$262
- Tax est. 1.5%
- −$62 /mo · $748/yr
- Insurance
- −$21
- HOA
- −$0
- Vacancy / Maint / Mgmt
- −$298
- Net cashflow
- $775
Break-even live
UW: 25.0% down · 7.5% · 30yr · 1.5% tax · 5.0% vac · 8.0% maint · 8.0% mgmt
Financing live
Cash to close
- Down payment
- $12,475
- Closing costs
- $1,497
- Reserves months
- —
- Total cash needed
- —
Loan-product check · same deal, 3 products live
Conventional
25% down · 7.5% · 30yr
- Down + closing
- —
- Monthly P&I
- —
- Monthly cashflow
- —
- DSCR
- —
- Eligible?
- —
Personal DTI + credit; lowest rate.
DSCR
20% down · 8.5% · 30yr
- Down + closing
- —
- Monthly P&I
- —
- Monthly cashflow
- —
- DSCR
- —
- Eligible?
- —
No personal income docs; deal must DSCR.
Hard money
10% down · 12.0% · 12mo
- Down + closing
- —
- Monthly P&I
- —
- Monthly cashflow
- —
- DSCR
- —
- Eligible?
- —
Short-term bridge; refi at stabilization.
Rent comps 4 comps
| Address | Beds | Baths | Sqft | Rent | $/sqft | DOM | Units | Dist |
|---|---|---|---|---|---|---|---|---|
| 18 Brook Hill Ln Rochester, NY | 1.0–2.0 | 1.0–1.5 | 841 | $1,915 | $2.28 | 2d | 1 | 0.94mi |
| 234 W Commercial St Unit 2 East Rochester, NY | 2.0 | 1.0 | 640 | $1,100 | $1.72 | 43d | 1 | 1.19mi |
| 120 Brebeuf Dr Penfield, NY | 2.0 | 1.0 | 763 | $1,365 | $1.79 | 3d | 6 | 1.45mi |
| 400 Main St Unit A6 East Rochester, NY | 1.0 | 1.0 | 450 | $995 | $2.21 | 21d | 1 | 1.47mi |
Listing history 12 events
-
2026-06-19status $49,900 Pending 16 DOM
-
2026-06-18days on market $49,900 Active 16 DOM
-
2026-06-17days on market $49,900 Active 15 DOM
-
2026-06-16days on market $49,900 Active 14 DOM
-
2026-06-15days on market $49,900 Active 13 DOM
-
2026-06-13days on market $49,900 Active 11 DOM
-
2026-06-10days on market $49,900 Active 8 DOM
-
2026-06-09days on market $49,900 Active 7 DOM
-
2026-06-09days on market $49,900 Active 6 DOM
-
2026-06-07days on market $49,900 Active 5 DOM
-
2026-06-03remarks 699-char remark
-
2026-06-03$49,900 Active 1 DOM
ⓘ Source: listings_history table (triggers on properties + properties_extension) + one-shot
backfill from property_details.listing_events for pre-trigger history.
Climate risk First Street
- Flood 1/10 Low FEMA zone X (unshaded) · 0% chance over 30 yrs
- Wildfire 1/10 Low
- Heat 2/10 Low 7 d/yr ≥95°F today · 15 d/yr by 30 yrs out
- Wind 1/10 Low
- Air quality 2/10 Low 1 unhealthy d/yr today · 2 by 30 yrs out
Nearby sold comps map
Loading sold comps map…
Walkable amenities ~0.75 mi
Loading nearby amenities…
Taxation est. · year 1
- Rental income
- $17,017
- − Mortgage interest
- −$2,795
- − Property taxes
- −$748
- − Insurance
- −$250
- − Repairs & maintenance
- −$1,361
- − Management
- −$1,361
- − Depreciation
- −$1,452
- Taxable income
- $9,050
- Est. tax owed @ 24.0%
- −$2,172
- After-tax cash flow
- $7,134/yr
For passive investors: Depreciation is non-cash, so a rental often shows a tax loss while cash-flowing — sheltering income. Rental losses are passive: they offset passive income freely, and up to $25,000/yr can offset ordinary (W-2) income if you actively participate and your MAGI is under $100k (phasing out to $0 by $150k); unused losses carry forward. On sale, claimed depreciation is recaptured at up to 25%, and gains may owe capital-gains tax (a 1031 exchange can defer both). Figures are a year-1 estimate at your 24.0% rate — not tax advice; consult a CPA.
Condition & rehab AI · 1 photo
This single-wide mobile home has been updated with new kitchen, bathroom, and HVAC systems, making it move-in ready with good curb appeal. Minor exterior painting and carpet replacement could further enhance its value.
Value-add opportunities
- Resale Paint exterior siding — Enhances curb appeal and can add value.
- Rental Replace carpeting — Fresh carpeting improves comfort and can attract renters.
Renovation cost estimate screening
Value-add ROI direction
- Resale Paint exterior siding — Enhances curb appeal and can add value. ↑
- Rental Replace carpeting — Fresh carpeting improves comfort and can attract renters. ↑
ⓘ Cost ranges are severity-bucket heuristics (US national rule-of-thumb). Get contractor quotes + a written scope before underwriting a rehab budget.
Schools (NCES district)
- District
- Penfield Central School District
- NCES district ID
- 3622710
- Math proficiency
- 77% ▼ -3.00%
- Reading proficiency
- 79% ▲ 10.00%
- Median HH income
- $74,802
- Composite
- 68.37/100
- National rank
- #347
- State rank
- #67 of 590 in NY
Livability — St. John Fisher College
No livability data for this city. (Only ~50 U.S. cities are tracked.)
Census & demographics
- Population (ZIP)
- 10,667
Population outlook (Monroe County) Hauer SSP2
- Today (2025)
- 759,460 people
- By 2030
- 757,154 · -0.3%
- By 2040
- 740,644 · -2.5%
- By 2050
- 714,443 · -5.9%
- By 2075
- 645,883 · -15.0%
- By 2100
- 547,084 · -28.0%
Race, ethnicity, and origin ACS 2023
- Neighborhood character
- Predominantly White (85%)
- Race & ethnicity
- White 85% Two or more races 10% Hispanic / Latino 6% Black 1% Asian 1%
- Hispanic origin (detail)
- Puerto Rican 1% Dominican 1%
- Common ancestry
- Romanian 7% Subsaharan African 3% Iranian 2%
- Foreign-born
- 7% · Canada, China
- Languages at home
- 92% English-only · Russian/Polish/Slavic 3% Spanish 2% Other Indo-European 2%
Political lean MEDSL · Monroe
- 2024 margin
- D (+19.1) · D 59.5% · R 40.5%
- 2008→2024 swing
- +1.4pp toward D · 2008: 17.7pp · 2024: 19.1pp
- All cycles
- 2024: D+19.1 2020: D+21.0 2016: D+14.1 2012: D+17.4 2008: D+17.7
Not yet ingested
- Civics
- —
Market trends
- HPI YoY
- ▼ -49.69%
- Current HPI
- 275.9721
- Rent YoY
- —
- Metro
- —
- State GDP YoY
- ▲ 2.60%
- F500 in state
- 92
Industry mix (Fortune 500 HQ in NY)
| Industry | F500 HQs | Revenue |
|---|---|---|
| Financial Services | 10 | $950B |
|
||
| Consumer Goods | 9 | $162B |
|
||
| Insurance | 4 | $225B |
|
||
| Telecommunications | 2 | $144B |
|
||
| Pharmaceuticals | 2 | $112B |
|
||
| Media / Entertainment | 2 | $69B |
|
||
Price history
-9.3% since first listed15 events — show timeline
- 2026-06-02 Listed $49,900 UNYREIS
- 2026-03-11 Sold (MLS) $20,000 UNYREIS
- 2026-03-02 Pending — UNYREIS
- 2026-02-19 Contingent — UNYREIS
- 2025-12-29 Price Changed $25,000 UNYREIS
- 2025-12-15 Price Changed $28,000 UNYREIS
- 2025-11-10 Listing Removed — UNYREIS
- 2025-11-10 Listed $30,000 UNYREIS
- 2025-10-25 Price Changed $35,000 UNYREIS
- 2025-10-22 Price Changed $40,000 UNYREIS
- 2025-10-06 Listing Removed — UNYREIS
- 2025-10-06 Listed $45,000 UNYREIS
- 2025-09-26 Price Changed $50,000 UNYREIS
- 2025-08-12 Price Changed $53,000 UNYREIS
- 2025-07-11 Listed $55,000 UNYREIS
Cash-flow waterfall
monthlySold comps — $/sqft
last 12 mo · ≤1 miLoading sold comps…