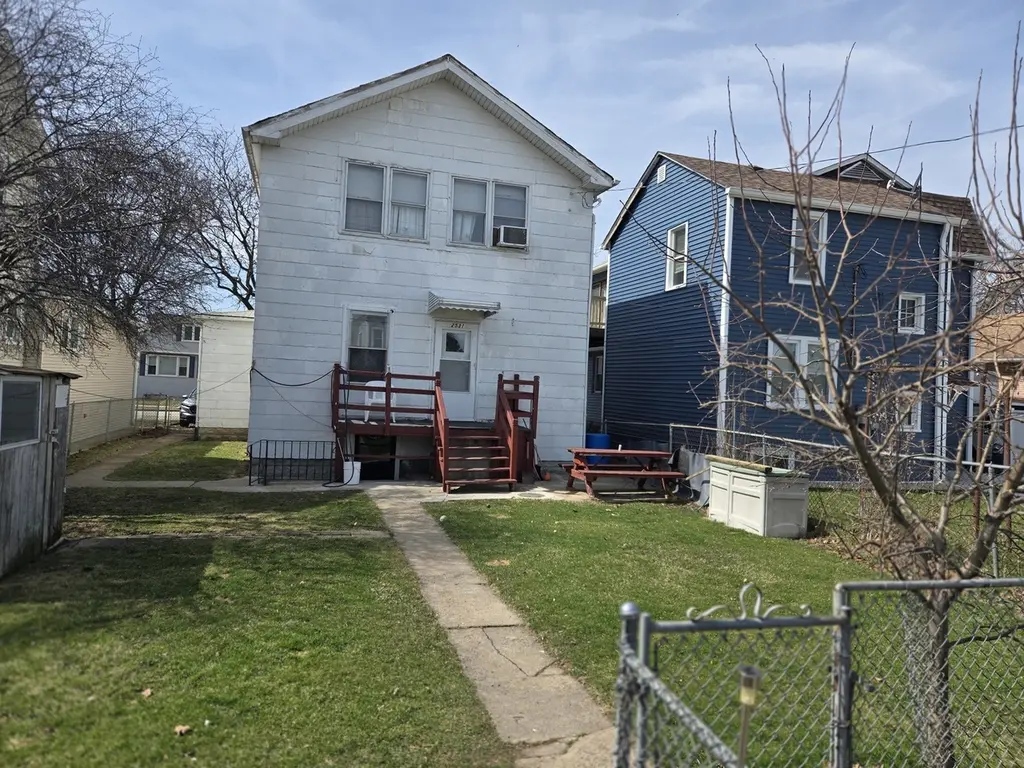
2531 N 75th Ave
Elmwood Park, IL 60707
$289,000B-
4 bd · 2.0 ba ·
1,840 sqft ·
Built 1923
· MultiFamily
· Active
· 44 DOM
Cashflow @ list (25.0% down · 7.5%)
Estimated rent
$3,676/mo
Mortgage (P&I)
−$1,516
Tax + insurance
−$409
HOA
−$0
Vac / Maint / Mgmt
−$772
Net cashflow
$980/mo
Annual
$11,758/yr
Cap rate
10.36%
Cash-on-cash
14.53%
DSCR
1.65
1% rule
1.27%
Cash to close
$80,920
Investor read
- This is a 4-bed/2.0-bath multifamily listed at $289k.
- At list price, monthly cash flow is $980 ($12k/yr) — positive.
- The deal already cash-flows at list — no discount required.
- Meets the 1% rule at list price ($4k rent vs $289k).
- It's been on market 44 days — a 3% lower offer ($280k) is reasonable based on typical stale-listing flexibility.
- Recommended offer: $280k (3.0% below list) — sets the bar for market timing.
- Local home prices are declining (-3.0%/yr); year-one equity from $2k of loan paydown is wiped out by about $9k of value loss. Plan a longer hold.
- Location reads 83/100 on livability (#41 in IL, #865 nationally) — a professional / high-income tenant draw. Strengths: commute A+, housing A+, crime A-; Watch: schools D+.
- Elmwood Park CUSD 401 (suburban): math 15% / reading 26% proficiency, ranked #403 of 620 in IL (top 65%) — low school quality limits family demand, transient renter base, plan for 1-2y turnover.
- Watch-outs: built in 1923 — expect roof / HVAC / electrical / plumbing capex.
- Market conditions: Rents rising fast (+7.2%/yr); 58 active listings in the ZIP; 28 comparable units currently listed for rent nearby; rentals leasing fast (median 13d on market — plan ~1-2 weeks tenant-placement turnaround); solid renter incomes; 6,272 units permitted in Cook County in 2024 (4,658 in 5+ unit buildings).
- Current owner paid $40k; list at $289k implies a 622% gain — meaningful room to come down on a strong offer.
- At projected returns (-3.0% appreciation + 7.2% rent growth), your $81k cash investment doubles in ~7 years — after that, you're playing with house money.
- Cap rate 10.4% vs local median 4.4% in Elmwood Park — top-decile yield for the area; either an underpriced asset or a hidden risk that comps aren't pricing in. Stress-test before assuming the spread holds.
- At $3,676/mo this rent would consume 52% of the median local household income ($85k/yr) (locally 1195% of renters already pay >50% of income on rent) — very limited rent-growth headroom before tenants either downsize or default.
Questions for listing agent
- It's been on market 44 days. Have you received any prior offers? Is the seller open to a 3% concession, seller financing, or rate buy-down credit?
- Built in 1923 — when were the roof, HVAC, electrical panel, plumbing, and water heater last replaced?
- Is there a deadline driving the sale (1031 exchange, divorce, estate, relocation)? That informs how much negotiation room exists.
- Schools are D-rated, which usually means shorter tenancies and higher turnover. Who's the typical renter profile here, and what's been the actual vacancy rate?
- What's the average days-on-market for RENTAL listings here right now (not sales)? A rising rental-DOM trend means longer vacancies and softer asking-rent achievability than the comps imply.
- What's the recent tenant-quality profile in this submarket — average credit score on applications, eviction rate, late-payment / NSF rate, and stable-employment percentage? A property-management company in the area should have these aggregated.
- How much new apartment / multifamily construction is in the pipeline within 1–3 miles? Heavy new supply (>2% of stock underway) typically softens rents 12–24 months out; light construction supports rent growth.
CashFlowRE · CFR-M4QAAD2ZTHYPEB
· Data 2 days ago
cashflowre.app · 2026-05-29