 Multi-family
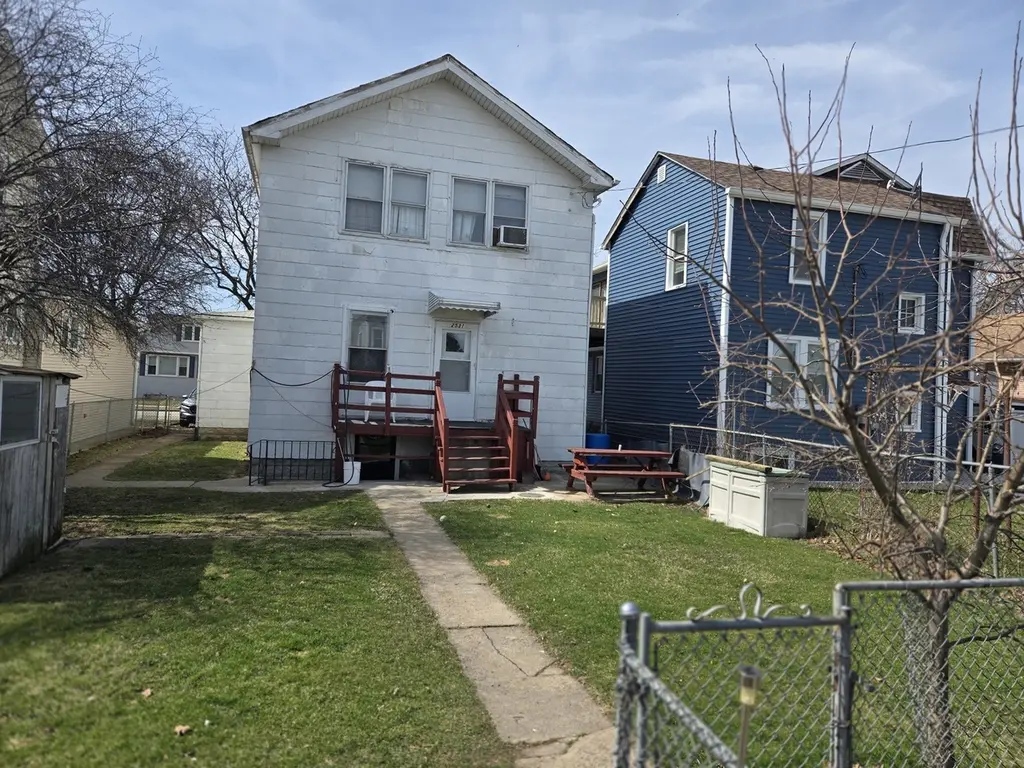
2531 N 75th Ave · Elmwood Park, IL
Flood risk 1/10 · Minimal
- FEMA flood zone
- X (unshaded)
- Chance of flooding over 30 yrs
- 0.0%
- Est. flood insurance / yr
- $473 – $860
Fire risk 1/10 · Minimal
- Est. fire insurance / yr
- $804 – $1,492
Heat risk 3/10 · Minor
- Hot days now (above 100°F)
- 7 days/yr
- Hot days in 30 yrs
- 14 days/yr
Wind risk 2/10 · Minimal
- Chance of severe wind over 30 yrs
- 1.0%
Air-quality risk 5/10 · Moderate
- Unhealthy air days now
- 6 days/yr
- Unhealthy air days in 30 yrs
- 8 days/yr
Risk factors via First Street. Map © Google.
Why this score? — see what drove the B- grade
The composite is a weighted blend of 9 inputs, each scored 0–100. Each bar is that input's sub-score; the figure is the points it added to the 100-point composite (weight × sub-score).
- Cash flow +28.9/30.0
- DSCR +10.0/10.0
- 1% rule +7.7/10.0
- ARV discount +7.5/15.0
- Rent growth +4.3/5.0
- Livability +4.2/5.0
- Condition / age +2.5/5.0
- Schools +1.9/10.0
- Appreciation +0.0/10.0
$289,000
🖨 Deal sheet 📄 Offer letter ✓ Due diligence
Multi-family units
County records classify this as Multi-Family (2-4 Unit). Listing-text estimate: 1 unit. estimate disagrees with records
Listing remarks
MOTIVATED SELLER: Elmwood Park 2-flat is currently owner-occupied. Each unit has 2 bedrooms and 1 bath. SOLD "as-is" property, seller will make no repairs, village inspection report under Additional Info.
Key facts
- 3 parking spots
- Built 1923
- Listed 44 days
Property features AI
Finance
- Other: Possession negotiable (close plus 30 days); Holds earnest money
- Financial info: Special service area: No; Tax exemptions: Homeowner, Senior, Senior Freeze
Exterior
- Parking: 3 parking spaces (total)
- Utilities: Water source: Lake Michigan; Public sewer
- Home design: Two- to four-unit building; Two units (duplex); Built over 100 years ago; Fee simple ownership
- Construction: Built before 1978
- Exterior features: Lot less than 0.25 acre; Lot dimensions: 4,688; Zoned for multi-family
Interior
- Kitchen: Stove; Refrigerator
- Bedrooms: 3 bedrooms total; Unit 1 (first floor): 2 bedrooms; Unit 2 (second floor): 2 bedrooms
- Bathrooms: 2 full bathrooms total; Unit 1: 1 full bathroom; Unit 2: 1 full bathroom
- Heating & cooling: Radiant heat
- Interior features: 11 total rooms; Partially finished, full basement
- Laundry & utility: Tenant pays: none (for listed units)
Neighborhood map
What this means for you Summary
Snapshot
- This is a 4-bed/2.0-bath multifamily listed at $289k.
Deal economics
- At list price, monthly cash flow is $980 ($12k/yr) — positive.
- The deal already cash-flows at list — no discount required.
- Meets the 1% rule at list price ($4k rent vs $289k).
- Recommended offer: $280k (3.0% below list) — sets the bar for market timing.
- Cap rate 10.4% vs local median 4.4% in Elmwood Park — top-decile yield for the area; either an underpriced asset or a hidden risk that comps aren't pricing in. Stress-test before assuming the spread holds.
Location & tenants
- Location reads 83/100 on livability (#41 in IL, #865 nationally) — a professional / high-income tenant draw. Strengths: commute A+, housing A+, crime A-; Watch: schools D+.
- Elmwood Park CUSD 401 (suburban): math 15% / reading 26% proficiency, ranked #403 of 620 in IL (top 65%) — low school quality limits family demand, transient renter base, plan for 1-2y turnover.
- Market conditions: Rents rising fast (+7.2%/yr); 58 active listings in the ZIP; 28 comparable units currently listed for rent nearby; rentals leasing fast (median 13d on market — plan ~1-2 weeks tenant-placement turnaround); solid renter incomes; 6,272 units permitted in Cook County in 2024 (4,658 in 5+ unit buildings).
- At $3,676/mo this rent would consume 52% of the median local household income ($85k/yr) (locally 1195% of renters already pay >50% of income on rent) — very limited rent-growth headroom before tenants either downsize or default.
Forward outlook
- Local home prices are declining (-3.0%/yr); year-one equity from $2k of loan paydown is wiped out by about $9k of value loss. Plan a longer hold.
- At projected returns (-3.0% appreciation + 7.2% rent growth), your $81k cash investment doubles in ~7 years — after that, you're playing with house money.
Negotiation context
- It's been on market 44 days — a 3% lower offer ($280k) is reasonable based on typical stale-listing flexibility.
- Current owner paid $40k; list at $289k implies a 622% gain — meaningful room to come down on a strong offer.
Risks & watch-outs
- Watch-outs: built in 1923 — expect roof / HVAC / electrical / plumbing capex.
Questions for the listing agent
- It's been on market 44 days. Have you received any prior offers? Is the seller open to a 3% concession, seller financing, or rate buy-down credit?
- Built in 1923 — when were the roof, HVAC, electrical panel, plumbing, and water heater last replaced?
- Is there a deadline driving the sale (1031 exchange, divorce, estate, relocation)? That informs how much negotiation room exists.
- Schools are D-rated, which usually means shorter tenancies and higher turnover. Who's the typical renter profile here, and what's been the actual vacancy rate?
- What's the average days-on-market for RENTAL listings here right now (not sales)? A rising rental-DOM trend means longer vacancies and softer asking-rent achievability than the comps imply.
- What's the recent tenant-quality profile in this submarket — average credit score on applications, eviction rate, late-payment / NSF rate, and stable-employment percentage? A property-management company in the area should have these aggregated.
- How much new apartment / multifamily construction is in the pipeline within 1–3 miles? Heavy new supply (>2% of stock underway) typically softens rents 12–24 months out; light construction supports rent growth.
Investment metrics
- 1% rule
- 1.27% ✓
- Cap rate
- 10.36%
- Cash-on-cash
- 14.53%
- DSCR
- 1.65
- GRM
- 6.6
CMA / ARV
- ARV (median comp)
- $838,069
- List price
- $289,000
- Delta
- -65.52%
- Verdict
- UNDERPRICED
- Comps
- 8 within 1.0 mi
Projected returns pro-forma
-3.0% appreciation · 7.21% rent growth · sell at horizon
- IRR
- 9.5%
- Equity multiple
- 1.39×
- Total profit
- $31,819
- Equity at exit
- $43,091
- IRR
- 21.9%
- Equity multiple
- 3.23×
- Total profit
- $180,764
- Equity at exit
- $24,987
Cash invested: $80,920 (down + closing). Projections, not guarantees.
Landlord ↔ Tenant lean methodology
- Overall (STATE)
- 43 Moderately Tenant-Leaning
- State Illinois
- 43 Moderately Tenant-Leaning · D+7
- County
- — inherits STATE
- City
- — inherits STATE
ZIP-level market 60707
- Rents YoY
- 7.2%
- Active inventory
- 58
- Price-to-rent
- 13.1×
Monthly cashflow live
- Estimated rent
- $3,676 high interval (Pro) →
- Mortgage (P&I)
- −$1,516
- Tax from tax record
- −$288 /mo · $3,458/yr
- Insurance
- −$120
- HOA
- −$0
- Vacancy / Maint / Mgmt
- −$772
- Net cashflow
- $980
Break-even live
2-unit breakdown (identical units grouped — click to expand)
| Units | Beds | Baths | Est. rent |
|---|---|---|---|
| 2× units | 2 | 1 | $3,676 |
| #1 | 2 | 1 | $1,838 |
| #2 | 2 | 1 | $1,838 |
| Total (2 units) | $3,676 | ||
UW: 25.0% down · 7.5% · 30yr · 1.5% tax · 5.0% vac · 8.0% maint · 8.0% mgmt
Financing live
Cash to close
- Down payment
- $72,250
- Closing costs
- $8,670
- Reserves months
- —
- Total cash needed
- —
Loan-product check · same deal, 3 products live
Conventional
25% down · 7.5% · 30yr
- Down + closing
- —
- Monthly P&I
- —
- Monthly cashflow
- —
- DSCR
- —
- Eligible?
- —
Personal DTI + credit; lowest rate.
DSCR
20% down · 8.5% · 30yr
- Down + closing
- —
- Monthly P&I
- —
- Monthly cashflow
- —
- DSCR
- —
- Eligible?
- —
No personal income docs; deal must DSCR.
Hard money
10% down · 12.0% · 12mo
- Down + closing
- —
- Monthly P&I
- —
- Monthly cashflow
- —
- DSCR
- —
- Eligible?
- —
Short-term bridge; refi at stabilization.
Rent comps 28 comps
| Address | Beds | Baths | Sqft | Rent | $/sqft | DOM | Units | Dist |
|---|---|---|---|---|---|---|---|---|
| 2530 N 74th Ave #3 Elmwood Park, IL | 3.0 | 2.0 | 1800 | $2,500 | $1.39 | 20d | 1 | 0.08mi |
| 2702 N 74th Ave Unit 2 Elmwood Park, IL | 3.0 | 1.5 | 1400 | $2,750 | $1.96 | 24d | 1 | 0.23mi |
| 7659 W Sunset Dr Elmwood Park, IL | 4.0 | 3.0 | 1600 | $3,400 | $2.12 | 24d | 1 | 0.36mi |
| 2442 N 77th Ct Unit 2 Elmwood Park, IL | 3.0 | 1.5 | 2000 | $2,509 | $1.25 | 43d | 1 | 0.37mi |
| 3007 Cottonwood Ln River Grove, IL | 4.0 | 3.5 | 2200 | $4,800 | $2.18 | 12d | 1 | 0.95mi |
| 3000 Cottonwood Ln River Grove, IL | 3.0–4.0 | 3.5 | 2159 | $5,300 | $2.45 | 1d | 7 | 0.95mi |
| 3002 Cottonwood Ln River Grove, IL | 4.0 | 3.5 | 2200 | $4,800 | $2.18 | 1d | 1 | 0.95mi |
| 3017 Cottonwood Ln River Grove, IL | 4.0 | 3.5 | 2200 | $4,800 | $2.18 | 17d | 1 | 0.97mi |
| 3007 Birch Ln River Grove, IL | 4.0 | 3.5 | 2200 | $4,500 | $2.05 | 22d | 1 | 0.97mi |
| 3006 Birch Ln River Grove, IL | 4.0 | 3.5 | 2200 | $5,300 | $2.41 | 1d | 1 | 0.97mi |
| 3016 Cottonwood Ln River Grove, IL | 4.0 | 3.5 | 2200 | $4,800 | $2.18 | 17d | 1 | 0.98mi |
| 3107 Cottonwood Ln River Grove, IL | 4.0 | 3.5 | 2200 | $4,800 | $2.18 | 24d | 1 | 0.99mi |
| 3100 Birch Ln River Grove, IL | 4.0 | 3.5 | 2200 | $5,300 | $2.41 | 1d | 1 | 1.01mi |
| 3106 Birch Ln River Grove, IL | 4.0 | 3.5 | 2200 | $5,300 | $2.41 | 1d | 1 | 1.02mi |
| 3115 Birch Ln River Grove, IL | 4.0 | 3.5 | 2200 | $4,800 | $2.18 | 12d | 1 | 1.03mi |
| 3117 Birch Ln River Grove, IL | 4.0 | 3.5 | 2200 | $5,000 | $2.27 | 12d | 1 | 1.03mi |
| 3017 Birch Ln River Grove, IL | 4.0 | 3.5 | 2200 | $4,800 | $2.18 | 13d | 1 | 1.03mi |
| 3102 Birch Ln River Grove, IL | 4.0 | 3.5 | 2200 | $5,000 | $2.27 | 2d | 1 | 1.03mi |
| 3114 Birch Ln River Grove, IL | 4.0 | 3.5 | 2200 | $5,000 | $2.27 | 5d | 1 | 1.03mi |
| 8036 Pine Ct River Grove, IL | 4.0 | 3.5 | 2200 | $5,300 | $2.41 | 1d | 1 | 1.04mi |
| 8001 Belmont Ave River Grove, IL | 1.0–3.0 | 1.0–3.0 | 1030 | $3,690 | $3.58 | 5d | 20 | 1.06mi |
| 8003 W Belmont Ave Unit 303 Chicago, IL | 3.0 | 2.0 | 1336 | $3,450 | $2.58 | 24d | 1 | 1.09mi |
| 8015 W Belmont Ave Unit 204 Chicago, IL | 3.0 | 2.0 | 1336 | $3,500 | $2.62 | 24d | 1 | 1.11mi |
| 8015 W Belmont Ave Unit 203 Chicago, IL | 3.0 | 2.0 | 1336 | $3,690 | $2.76 | 24d | 1 | 1.11mi |
| 8212 W Walsh Ln Apt 1 River Grove, IL | 3.0 | 3.0 | 2200 | $2,600 | $1.18 | 2d | 1 | 1.14mi |
| 1619 N Neva Ave Chicago, IL | 1.0–3.0 | 1.0–2.5 | 1654 | $4,376 | $2.64 | 2d | 41 | 1.23mi |
| 2112 N Nashville Ave Chicago, IL | 2.0–4.0 | 2.0–3.0 | 1482 | $4,699 | $3.17 | 3d | 15 | 1.26mi |
| 8536 River Grove Ave River Grove, IL | 3.0 | 2.0 | 1424 | $3,100 | $2.18 | 14d | 1 | 1.39mi |
Listing history 16 events
-
2026-06-18days on market $289,000 Active 44 DOM
-
2026-06-17days on market $289,000 Active 43 DOM
-
2026-06-16days on market $289,000 Active 42 DOM
-
2026-06-15days on market $289,000 Active 41 DOM
-
2026-06-13days on market $289,000 Active 39 DOM
-
2026-06-13days on market $289,000 Active 38 DOM
-
2026-06-09days on market $289,000 Active 35 DOM
-
2026-06-08days on market $289,000 Active 34 DOM
-
2026-06-07pricedays on market $289,000 Active 33 DOM
-
2026-06-04days on market $325,000 Active 30 DOM
-
2026-06-03days on market $325,000 Active 29 DOM
-
2026-06-02days on market $325,000 Active 28 DOM
-
2026-06-01days on market $325,000 Active 27 DOM
-
2026-05-31days on market $325,000 Active 26 DOM
-
2026-05-05$325,000 Active 214-char remark
-
1995-04-24soldstatus $40,000
ⓘ Source: listings_history table (triggers on properties + properties_extension) + one-shot
backfill from property_details.listing_events for pre-trigger history.
Tax reassessment forecast IL · Partial reset (capped growth)
- Current annual tax
- $3,458 · $288/mo
- Projected year-2 tax
- $5,009 · $417/mo
- Expected delta
- +$1,551/yr (+$129/mo · 44.8%)
ⓘ Screening estimate from a state-policy table — verify with the county assessor before closing.
Climate risk First Street
- Flood 1/10 Low FEMA zone X (unshaded) · 0% chance over 30 yrs
- Wildfire 1/10 Low
- Heat 3/10 Moderate 7 d/yr ≥100°F today · 14 d/yr by 30 yrs out
- Wind 2/10 Low 100% chance of damaging wind over 30 yrs
- Air quality 5/10 Major 6 unhealthy d/yr today · 8 by 30 yrs out
Nearby sold comps map
Loading sold comps map…
Walkable amenities ~0.75 mi
Loading nearby amenities…
Taxation est. · year 1
- Rental income
- $44,112
- − Mortgage interest
- −$16,188
- − Property taxes
- −$3,458
- − Insurance
- −$1,445
- − Repairs & maintenance
- −$3,529
- − Management
- −$3,529
- − Depreciation
- −$8,407
- Taxable income
- $7,555
- Est. tax owed @ 24.0%
- −$1,813
- After-tax cash flow
- $9,945/yr
For passive investors: Depreciation is non-cash, so a rental often shows a tax loss while cash-flowing — sheltering income. Rental losses are passive: they offset passive income freely, and up to $25,000/yr can offset ordinary (W-2) income if you actively participate and your MAGI is under $100k (phasing out to $0 by $150k); unused losses carry forward. On sale, claimed depreciation is recaptured at up to 25%, and gains may owe capital-gains tax (a 1031 exchange can defer both). Figures are a year-1 estimate at your 24.0% rate — not tax advice; consult a CPA.
Schools (NCES district)
- District
- Elmwood Park CUSD 401
- NCES district ID
- 1714100
- Math proficiency
- 15% ▼ -14.00%
- Reading proficiency
- 26% ▼ -14.00%
- Median HH income
- $54,600
- Composite
- 18.73/100
- National rank
- #8879
- State rank
- #403 of 620 in IL
Livability — Elmwood Park
- Score
- 83/100
- State rank
- #41
- US rank
- #865
Category grades
Schools grade is shown separately in the Schools card above.
Census & demographics
- Census place
- Elmwood Park, IL
- County
- Cook County · 4,486,803 people
- City population
- 41,116
- Metro
- Chicago-Naperville-Elgin, IL-IN-WI
- Population (ZIP)
- 41,116
- Household income
- $84,799
- Rent vs Own
- Severe rent burden
- 1195.0
Population outlook (Cook County) Hauer SSP2
- Today (2025)
- 5,347,519 people
- By 2030
- 5,357,703 · +0.2%
- By 2040
- 5,324,924 · -0.4%
- By 2050
- 5,230,762 · -2.2%
- By 2075
- 4,785,735 · -10.5%
- By 2100
- 4,188,836 · -21.7%
Race, ethnicity, and origin ACS 2023
- Neighborhood character
- Diverse neighborhood (Simpson 0.61)
- Race & ethnicity
- White 45% Hispanic / Latino 43% Two or more races 14% Black 7% Asian 3%
- Hispanic origin (detail)
- Mexican 22% Puerto Rican 12% Cuban 1%
- Common ancestry
- Romanian 13% Subsaharan African 2% Scotch-Irish 1%
- Foreign-born
- 25% · Canada, Jamaica, Dominican Republic
- Languages at home
- 54% English-only · Spanish 29% Russian/Polish/Slavic 11% Other Indo-European 3%
Political lean MEDSL · Cook
- 2024 margin
- Solid D (+42.0) · D 70.4% · R 28.4% · Other 1.2%
- 2008→2024 swing
- -11.4pp toward R · 2008: 53.4pp · 2024: 42.0pp
- All cycles
- 2024: D+42.0 2020: D+50.3 2016: D+53.0 2012: D+49.4 2008: D+53.4
Not yet ingested
- Civics
- —
Market trends
- HPI YoY
- ▼ -256.46%
- Current HPI
- 222.8083
- Rent YoY
- ▲ 7.21%
- Metro
- Chicago-Naperville-Elgin, IL-IN-WI
- State GDP YoY
- ▲ 1.59%
- F500 in state
- 60
Industry mix (Fortune 500 HQ in IL)
| Industry | F500 HQs | Revenue |
|---|---|---|
| Insurance | 4 | $201B |
|
||
| Consumer Goods | 4 | $87B |
|
||
| Industrial Machinery | 3 | $64B |
|
||
| Healthcare | 2 | $55B |
|
||
| Retail / Pharmacy | 1 | $148B |
|
||
| Agriculture / Food | 1 | $86B |
|
||
Price history
+622.5% since first listed3 events — show timeline
- 2026-06-06 Price Changed $289,000 MRED as Distributed by MLS Grid
- 2026-05-05 Listed $325,000 MRED as Distributed by MLS Grid
- 1995-04-24 Sold (Public Records) $40,000 Public Records
Property tax history
-0.7%/yrLatest (2023): $3,458 · -0.1% YoY. Source: county tax records.
Cash-flow waterfall
monthlySold comps — $/sqft
last 12 mo · ≤1 miLoading sold comps…