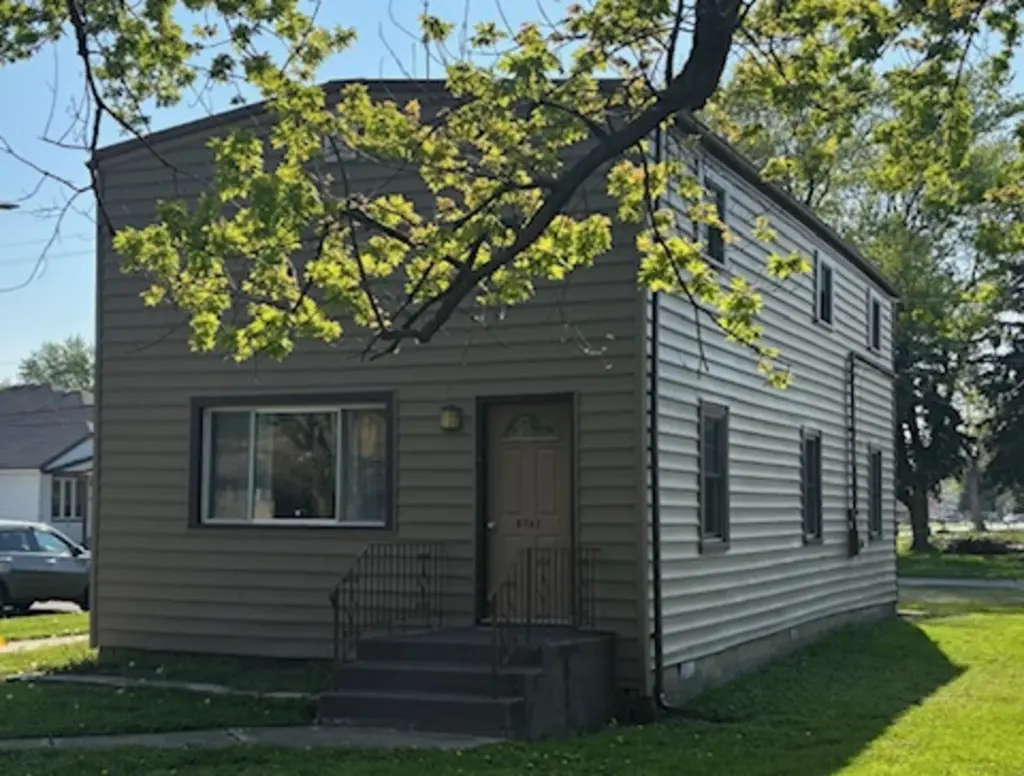
8762 Central Ave
Oak Lawn, IL 60453
$219,900B+
4 bd · 2.0 ba ·
2,000 sqft ·
Built —
· SingleFamily
· Active
· 48 DOM
Cashflow @ list (25.0% down · 7.5%)
Estimated rent
$3,351/mo
Mortgage (P&I)
−$1,153
Tax + insurance
−$366
HOA
−$0
Vac / Maint / Mgmt
−$704
Net cashflow
$1,128/mo
Annual
$13,535/yr
Cap rate
12.45%
Cash-on-cash
21.98%
DSCR
1.98
1% rule
1.52%
Cash to close
$61,572
Investor read
- This is a 4-bed/2.0-bath single-family listed at $220k. Condition is rated fair.
- At list price, monthly cash flow is $1k ($14k/yr) — positive.
- The deal already cash-flows at list — no discount required.
- Meets the 1% rule at list price ($3k rent vs $220k).
- It's been on market 48 days — a 3% lower offer ($213k) is reasonable based on typical stale-listing flexibility.
- Recommended offer: $213k (3.0% below list) — sets the bar for market timing.
- Local home prices are declining (-3.0%/yr); year-one equity from $2k of loan paydown is wiped out by about $7k of value loss. Plan a longer hold.
- Location reads 80/100 on livability (#102 in IL, #1,614 nationally) — a professional / high-income tenant draw. Strengths: commute A+, housing A+, employment A-.
- Oak Lawn Chsd 229 (suburban): math 22% / reading 21% proficiency, ranked #384 of 620 in IL (top 62%) — low school quality limits family demand, transient renter base, plan for 1-2y turnover.
- Zoned schools: Oak Lawn Comm High School (math 22% / reading 21%, grade F, #345 of 693 statewide, top 50%, 1,834 students, 0% FRL).
- Market conditions: Rents rising fast (+8.2%/yr); 188 active listings in the ZIP; 3 comparable units currently listed for rent nearby; rentals leasing fast (median 11d on market — plan ~1-2 weeks tenant-placement turnaround); solid renter incomes; 6,272 units permitted in Cook County in 2024 (4,658 in 5+ unit buildings).
- At projected returns (-3.0% appreciation + 8.0% rent growth), your $62k cash investment doubles in ~5 years — after that, you're playing with house money.
- Cap rate 12.4% vs local median 4.4% in Oak Lawn — top-decile yield for the area; either an underpriced asset or a hidden risk that comps aren't pricing in. Stress-test before assuming the spread holds.
- At $3,351/mo this rent would consume 48% of the median local household income ($84k/yr) (locally 827% of renters already pay >50% of income on rent) — very limited rent-growth headroom before tenants either downsize or default.
Questions for listing agent
- It's been on market 48 days. Have you received any prior offers? Is the seller open to a 3% concession, seller financing, or rate buy-down credit?
- Have any recent inspections been done? Can we get a copy of the seller's disclosures and any deferred-maintenance estimates?
- Is there a deadline driving the sale (1031 exchange, divorce, estate, relocation)? That informs how much negotiation room exists.
- What's the average days-on-market for RENTAL listings here right now (not sales)? A rising rental-DOM trend means longer vacancies and softer asking-rent achievability than the comps imply.
- What's the recent tenant-quality profile in this submarket — average credit score on applications, eviction rate, late-payment / NSF rate, and stable-employment percentage? A property-management company in the area should have these aggregated.
- How much new for-sale + rental construction is in the pipeline within 1–3 miles? Heavy new supply typically softens prices + rents 12–24 months out; constrained supply supports both.
Repairs flagged (vision-AI assessment)
- Major: Exterior siding — The exterior siding appears weathered and shows signs of wear, with some discoloration and possible peeling.
- Minor: Kitchen cabinets — The cabinets are in fair condition, but the countertops and appliances appear dated and worn.
- Minor: Bathroom fixtures — The bathrooms have basic fixtures and appear to be in fair condition, but the walls and ceilings show some discoloration and stains.
CashFlowRE · CFR-M613F3DAEKDY5W
· Data 2 days ago
cashflowre.app · 2026-05-29