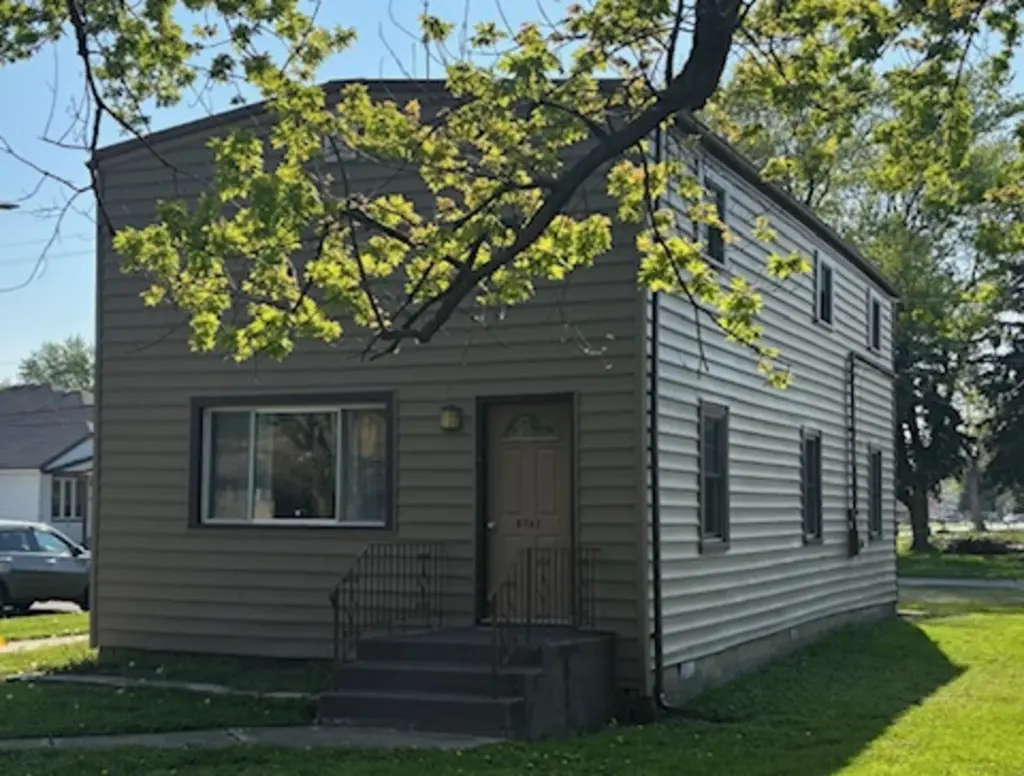
8762 Central Ave · Oak Lawn, IL
Flood risk 1/10 · Minimal
- FEMA flood zone
- X (unshaded)
- Chance of flooding over 30 yrs
- 0.0%
- Est. flood insurance / yr
- $507 – $1,088
Fire risk 1/10 · Minimal
- Est. fire insurance / yr
- $804 – $1,492
Heat risk 3/10 · Minor
- Hot days now (above 101°F)
- 7 days/yr
- Hot days in 30 yrs
- 15 days/yr
Wind risk 2/10 · Minimal
- Chance of severe wind over 30 yrs
- 0.0%
Air-quality risk 3/10 · Minor
- Unhealthy air days now
- 4 days/yr
- Unhealthy air days in 30 yrs
- 4 days/yr
Risk factors via First Street. Map © Google.
Why this score? — see what drove the B+ grade
The composite is a weighted blend of 9 inputs, each scored 0–100. Each bar is that input's sub-score; the figure is the points it added to the 100-point composite (weight × sub-score).
- Cash flow +30.0/30.0
- ARV discount +15.0/15.0
- 1% rule +10.0/10.0
- DSCR +10.0/10.0
- Rent growth +4.6/5.0
- Livability +4.0/5.0
- Condition / age +2.2/5.0
- Schools +1.9/10.0
- Appreciation +0.0/10.0
$219,900
🖨 Deal sheet 📄 Offer letter ✓ Due diligence
Listing remarks
A SPACIOUS 2,OOO SQ FT, TWO-STORY HOME FEATURING 4 BEDROOMS AND 2 BATH LOCATED IN OAK LAWN OFFERING A PRIME OPPORTUNITY FOR CUSTOMIZATION AND TRANSFORMATION INTO A DREAM HOME. MANY POSSIBILITES. .. .. HOME NEEDS TLC
Key facts
- 3,000 sq ft lot
- 2 parking spots
- Listed 48 days
Property features AI
Finance
- Other: Parcel number available
- HOA & community: No master association fee required
Exterior
- Parking: Two owned parking spaces
- Utilities: Water from Lake Michigan; Public sewer
- Home design: Detached single-family home; Two stories; Fee simple ownership; Estimated living area; Home built approximately 61–70 years ago; Built before 1978
- Construction: Vinyl siding exterior
- Exterior features: Lot dimensions approximately 30 x 100; Less than 0.25 acre lot; Access to school bus, commuter bus, commuter train and interstate
Interior
- Kitchen: Range; Refrigerator; Kitchen on main level
- Bedrooms: Four bedrooms (master on main; three additional bedrooms on second floor)
- Flooring: Carpet in living room and one upstairs bedroom; Vinyl flooring in kitchen and dining room; Other flooring in master bedroom and two other bedrooms/sitting room
- Bathrooms: Two full bathrooms
- Heating & cooling: Natural gas forced-air heating
- Interior features: Eight total rooms; Crawl space basement; All windows have treatments
- Laundry & utility: Dedicated laundry room
Neighborhood map
What this means for you Summary
Snapshot
- This is a 4-bed/2.0-bath single-family listed at $220k. Condition is rated fair.
Deal economics
- At list price, monthly cash flow is $1k ($14k/yr) — positive.
- The deal already cash-flows at list — no discount required.
- Meets the 1% rule at list price ($3k rent vs $220k).
- Recommended offer: $213k (3.0% below list) — sets the bar for market timing.
- Cap rate 12.4% vs local median 4.4% in Oak Lawn — top-decile yield for the area; either an underpriced asset or a hidden risk that comps aren't pricing in. Stress-test before assuming the spread holds.
Location & tenants
- Location reads 80/100 on livability (#102 in IL, #1,614 nationally) — a professional / high-income tenant draw. Strengths: commute A+, housing A+, employment A-.
- Oak Lawn Chsd 229 (suburban): math 22% / reading 21% proficiency, ranked #384 of 620 in IL (top 62%) — low school quality limits family demand, transient renter base, plan for 1-2y turnover.
- Zoned schools: Oak Lawn Comm High School (math 22% / reading 21%, grade F, #345 of 693 statewide, top 50%, 1,834 students, 0% FRL).
- Market conditions: Rents rising fast (+8.2%/yr); 188 active listings in the ZIP; 3 comparable units currently listed for rent nearby; rentals leasing fast (median 10d on market — plan ~1-2 weeks tenant-placement turnaround); solid renter incomes; 6,272 units permitted in Cook County in 2024 (4,658 in 5+ unit buildings).
- At $3,351/mo this rent would consume 48% of the median local household income ($84k/yr) (locally 827% of renters already pay >50% of income on rent) — very limited rent-growth headroom before tenants either downsize or default.
Forward outlook
- Local home prices are declining (-3.0%/yr); year-one equity from $2k of loan paydown is wiped out by about $7k of value loss. Plan a longer hold.
- At projected returns (-3.0% appreciation + 8.0% rent growth), your $62k cash investment doubles in ~5 years — after that, you're playing with house money.
Negotiation context
- It's been on market 48 days — a 3% lower offer ($213k) is reasonable based on typical stale-listing flexibility.
Questions for the listing agent
- It's been on market 48 days. Have you received any prior offers? Is the seller open to a 3% concession, seller financing, or rate buy-down credit?
- Have any recent inspections been done? Can we get a copy of the seller's disclosures and any deferred-maintenance estimates?
- Is there a deadline driving the sale (1031 exchange, divorce, estate, relocation)? That informs how much negotiation room exists.
- What's the average days-on-market for RENTAL listings here right now (not sales)? A rising rental-DOM trend means longer vacancies and softer asking-rent achievability than the comps imply.
- What's the recent tenant-quality profile in this submarket — average credit score on applications, eviction rate, late-payment / NSF rate, and stable-employment percentage? A property-management company in the area should have these aggregated.
- How much new for-sale + rental construction is in the pipeline within 1–3 miles? Heavy new supply typically softens prices + rents 12–24 months out; constrained supply supports both.
Investment metrics
- 1% rule
- 1.52% ✓
- Cap rate
- 12.45%
- Cash-on-cash
- 21.98%
- DSCR
- 1.98
- GRM
- 5.5
CMA / ARV
- ARV (on-the-fly)
- $380,000
- Comps found
- 12
Show comp detail 12 sales within ~0.75 mi
| Address | Dist | Beds/Ba | Sqft | Sold | Price | $/sf | Match |
|---|---|---|---|---|---|---|---|
| 5710 W 89th Pl | 0.24mi | 3/2.0 (-1) | 2,089 (+4%) | 6mo | $380,000 | $182 | 72 |
| 8744 Central Ave | 0.02mi | 5/3.0 (+1) | 1,800 (-10%) | 5mo | $312,500 | $174 | 69 |
| 5175 W 88th Pl | 0.53mi | 4/2.0 | 1,997 (-0%) | 8mo | $380,000 | $190 | 68 |
| 8619 Linder Ave | 0.27mi | 4/3.0 | 1,815 (-9%) | 4mo | $480,000 | $264 | 64 |
| 9111 S 55th Ave | 0.44mi | 4/2.5 | 1,876 (-6%) | 5mo | $420,000 | $224 | 63 |
| 8847 Meade Ave | 0.60mi | 3/2.5 (-1) | 2,036 (+2%) | 2mo | $420,000 | $206 | 60 |
| 9100 Lynwood Dr | 0.62mi | 4/1.0 | 2,013 (+1%) | 8mo | $285,000 | $142 | 60 |
| 8548 Lockwood Ave | 0.48mi | 3/2.0 (-1) | 2,200 (+10%) | 7mo | $457,000 | $208 | 50 |
| 8433 Long Ave | 0.53mi | 4/1.0 | 1,800 (-10%) | 7mo | $295,000 | $164 | 49 |
| 8210 Linder Ave | 0.73mi | 4/2.0 | 1,807 (-10%) | 1mo | $387,000 | $214 | 49 |
| 5368 Otto Pl | 0.41mi | 3/1.0 (-1) | 1,759 (-12%) | 6mo | $225,000 | $128 | 47 |
| 9300 Major Ave | 0.65mi | 3/2.5 (-1) | 1,808 (-10%) | 0mo | $265,000 | $147 | 46 |
Match score weights: distance 35% · size 25% · config 20% · recency 20%. Top-matched comps best support the ARV.
Projected returns pro-forma
-3.0% appreciation · 8.0% rent growth · sell at horizon
- IRR
- 20.2%
- Equity multiple
- 1.88×
- Total profit
- $53,964
- Equity at exit
- $32,788
- IRR
- 31.7%
- Equity multiple
- 4.58×
- Total profit
- $220,307
- Equity at exit
- $19,013
Cash invested: $61,572 (down + closing). Projections, not guarantees.
Landlord ↔ Tenant lean methodology
- Overall (STATE)
- 43 Moderately Tenant-Leaning
- State Illinois
- 43 Moderately Tenant-Leaning · D+7
- County
- — inherits STATE
- City
- — inherits STATE
ZIP-level market 60453
- Rents YoY
- 8.2%
- Active inventory
- 188
- Price-to-rent
- 5.5×
Monthly cashflow live
- Estimated rent
- $3,351 medium interval (Pro) →
- Mortgage (P&I)
- −$1,153
- Tax est. 1.5%
- −$275 /mo · $3,298/yr
- Insurance
- −$92
- HOA
- −$0
- Vacancy / Maint / Mgmt
- −$704
- Net cashflow
- $1,128
Break-even live
UW: 25.0% down · 7.5% · 30yr · 1.5% tax · 5.0% vac · 8.0% maint · 8.0% mgmt
Financing live
Cash to close
- Down payment
- $54,975
- Closing costs
- $6,597
- Reserves months
- —
- Total cash needed
- —
Loan-product check · same deal, 3 products live
Conventional
25% down · 7.5% · 30yr
- Down + closing
- —
- Monthly P&I
- —
- Monthly cashflow
- —
- DSCR
- —
- Eligible?
- —
Personal DTI + credit; lowest rate.
DSCR
20% down · 8.5% · 30yr
- Down + closing
- —
- Monthly P&I
- —
- Monthly cashflow
- —
- DSCR
- —
- Eligible?
- —
No personal income docs; deal must DSCR.
Hard money
10% down · 12.0% · 12mo
- Down + closing
- —
- Monthly P&I
- —
- Monthly cashflow
- —
- DSCR
- —
- Eligible?
- —
Short-term bridge; refi at stabilization.
Rent comps 3 comps
| Address | Beds | Baths | Sqft | Rent | $/sqft | DOM | Units | Dist |
|---|---|---|---|---|---|---|---|---|
| 5212 Avery Pl Unit 1545958P Oak Lawn, IL | 3.0 | 1.0 | 2195 | $3,548 | $1.62 | 10d | 1 | 0.43mi |
| 5330 W 86th St Burbank, IL | 4.0 | 2.0 | 2300 | $4,100 | $1.78 | 1d | 1 | 0.45mi |
| 8621 Natchez Ave Burbank, IL | 3.0 | 3.0 | 2000 | $2,900 | $1.45 | 21d | 1 | 1.09mi |
Listing history 18 events
-
2026-06-18days on market $219,900 Active 48 DOM
-
2026-06-17days on market $219,900 Active 47 DOM
-
2026-06-16days on market $219,900 Active 46 DOM
-
2026-06-15days on market $219,900 Active 45 DOM
-
2026-06-13days on market $219,900 Active 43 DOM
-
2026-06-13days on market $219,900 Active 42 DOM
-
2026-06-09pricedays on market $219,900 Active 39 DOM
-
2026-06-08days on market $229,900 Active 38 DOM
-
2026-06-07days on market $229,900 Active 37 DOM
-
2026-06-04days on market $229,900 Active 34 DOM
-
2026-06-03days on market $229,900 Active 33 DOM
-
2026-06-02days on market $229,900 Active 32 DOM
-
2026-06-01days on market $229,900 Active 31 DOM
-
2026-05-31days on market $229,900 Active 30 DOM
-
2025-11-30historical
-
2025-08-21Active
-
2025-04-30historical
-
2025-01-29Active
ⓘ Source: listings_history table (triggers on properties + properties_extension) + one-shot
backfill from property_details.listing_events for pre-trigger history.
Climate risk First Street
- Flood 1/10 Low FEMA zone X (unshaded) · 0% chance over 30 yrs
- Wildfire 1/10 Low
- Heat 3/10 Moderate 7 d/yr ≥101°F today · 15 d/yr by 30 yrs out
- Wind 2/10 Low 0% chance of damaging wind over 30 yrs
- Air quality 3/10 Moderate 4 unhealthy d/yr today · 4 by 30 yrs out
Nearby sold comps map
Loading sold comps map…
Walkable amenities ~0.75 mi
Loading nearby amenities…
Taxation est. · year 1
- Rental income
- $40,216
- − Mortgage interest
- −$12,318
- − Property taxes
- −$3,298
- − Insurance
- −$1,100
- − Repairs & maintenance
- −$3,217
- − Management
- −$3,217
- − Depreciation
- −$6,397
- Taxable income
- $10,669
- Est. tax owed @ 24.0%
- −$2,560
- After-tax cash flow
- $10,974/yr
For passive investors: Depreciation is non-cash, so a rental often shows a tax loss while cash-flowing — sheltering income. Rental losses are passive: they offset passive income freely, and up to $25,000/yr can offset ordinary (W-2) income if you actively participate and your MAGI is under $100k (phasing out to $0 by $150k); unused losses carry forward. On sale, claimed depreciation is recaptured at up to 25%, and gains may owe capital-gains tax (a 1031 exchange can defer both). Figures are a year-1 estimate at your 24.0% rate — not tax advice; consult a CPA.
Condition & rehab AI · 13 photos
This two-story home requires moderate renovations, including painting, updating the kitchen and bathrooms, and improving the exterior siding. The home has potential for increased value with these updates.
Repairs flagged
- Major Exterior siding — The exterior siding appears weathered and shows signs of wear, with some discoloration and possible peeling.
- Minor Kitchen cabinets — The cabinets are in fair condition, but the countertops and appliances appear dated and worn.
- Minor Bathroom fixtures — The bathrooms have basic fixtures and appear to be in fair condition, but the walls and ceilings show some discoloration and stains.
Value-add opportunities
- Resale Paint interior walls and ceilings — Painting the interior walls and ceilings can significantly improve the home's appearance and increase its resale value.
- Resale Replace worn-out kitchen countertops and appliances — Upgrading the kitchen countertops and appliances can significantly improve the home's appearance and increase its resale value.
- Resale Replace worn-out bathroom fixtures — Upgrading the bathroom fixtures can significantly improve the home's appearance and increase its resale value.
- Both Landscaping and curb appeal — Improving the landscaping and curb appeal can increase the home's resale and rental value by making it more attractive to potential buyers and renters.
Renovation cost estimate screening
| Repair item | Severity | Est. cost |
|---|---|---|
| Exterior siding · The exterior siding appears weathered and shows signs of wear, with some discoloration and possible peeling. | Major | $15,000–50,000 |
| Kitchen cabinets · The cabinets are in fair condition, but the countertops and appliances appear dated and worn. | Minor | $500–3,000 |
| Bathroom fixtures · The bathrooms have basic fixtures and appear to be in fair condition, but the walls and ceilings show some discoloration and stains. | Minor | $500–3,000 |
| Total estimated repair cost · 3 items | $16,000–56,000 |
Value-add ROI direction
- Resale Paint interior walls and ceilings — Painting the interior walls and ceilings can significantly improve the home's appearance and increase its resale value. ↑
- Resale Replace worn-out kitchen countertops and appliances — Upgrading the kitchen countertops and appliances can significantly improve the home's appearance and increase its resale value. ↑
- Resale Replace worn-out bathroom fixtures — Upgrading the bathroom fixtures can significantly improve the home's appearance and increase its resale value. ↑
- Both Landscaping and curb appeal — Improving the landscaping and curb appeal can increase the home's resale and rental value by making it more attractive to potential buyers and renters. ↑
ⓘ Cost ranges are severity-bucket heuristics (US national rule-of-thumb). Get contractor quotes + a written scope before underwriting a rehab budget.
Schools (NCES district)
- District
- Oak Lawn Chsd 229
- NCES district ID
- 1729220
- Math proficiency
- 22% ▼ -4.00%
- Reading proficiency
- 21% ▼ -4.00%
- Median HH income
- $52,505
- Composite
- 19.41/100
- National rank
- #8777
- State rank
- #384 of 620 in IL
Livability — Oak Lawn
- Score
- 80/100
- State rank
- #102
- US rank
- #1614
Category grades
Schools grade is shown separately in the Schools card above.
Census & demographics
- Census place
- Oak Lawn, IL
- County
- Cook County · 4,486,803 people
- City population
- 56,861
- Metro
- Chicago-Naperville-Elgin, IL-IN-WI
- Population (ZIP)
- 56,861
- Household income
- $83,911
- Rent vs Own
- Severe rent burden
- 827.0
Population outlook (Cook County) Hauer SSP2
- Today (2025)
- 5,347,519 people
- By 2030
- 5,357,703 · +0.2%
- By 2040
- 5,324,924 · -0.4%
- By 2050
- 5,230,762 · -2.2%
- By 2075
- 4,785,735 · -10.5%
- By 2100
- 4,188,836 · -21.7%
Race, ethnicity, and origin ACS 2023
- Neighborhood character
- Majority White (64%)
- Race & ethnicity
- White 64% Hispanic / Latino 24% Two or more races 9% Black 8% Asian 2%
- Hispanic origin (detail)
- Mexican 21%
- Common ancestry
- Romanian 16% Iranian 1% Armenian 1%
- Foreign-born
- 16% · Canada, Vietnam
- Languages at home
- 70% English-only · Spanish 17% Russian/Polish/Slavic 5% Arabic 4%
Political lean MEDSL · Cook
- 2024 margin
- Solid D (+42.0) · D 70.4% · R 28.4% · Other 1.2%
- 2008→2024 swing
- -11.4pp toward R · 2008: 53.4pp · 2024: 42.0pp
- All cycles
- 2024: D+42.0 2020: D+50.3 2016: D+53.0 2012: D+49.4 2008: D+53.4
Not yet ingested
- Civics
- —
Market trends
- HPI YoY
- ▼ -259.83%
- Current HPI
- 214.6977
- Rent YoY
- ▲ 8.23%
- Metro
- Chicago-Naperville-Elgin, IL-IN-WI
- State GDP YoY
- ▲ 1.59%
- F500 in state
- 60
Industry mix (Fortune 500 HQ in IL)
| Industry | F500 HQs | Revenue |
|---|---|---|
| Insurance | 4 | $201B |
|
||
| Consumer Goods | 4 | $87B |
|
||
| Industrial Machinery | 3 | $64B |
|
||
| Healthcare | 2 | $55B |
|
||
| Retail / Pharmacy | 1 | $148B |
|
||
| Agriculture / Food | 1 | $86B |
|
||
Cash-flow waterfall
monthlySold comps — $/sqft
last 12 mo · ≤1 miLoading sold comps…