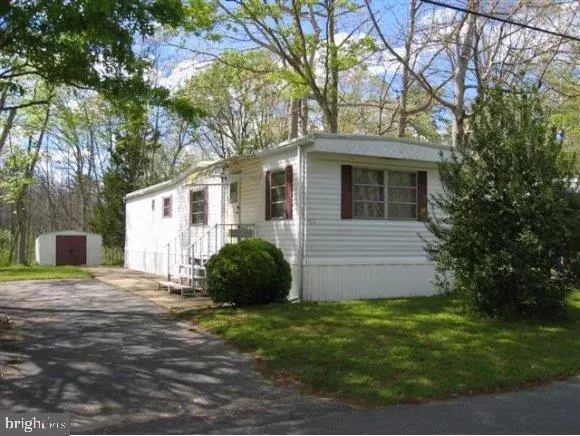
142 Chestnut
Ocean Acres, NJ 08005
$8,000D
2 bd · 1.0 ba ·
700 sqft ·
Built 1978
· SingleFamily
· Active
· 23 DOM
Cashflow @ list (25.0% down · 7.5%)
Estimated rent
$2,280/mo
Mortgage (P&I)
−$42
Tax + insurance
−$13
HOA
−$913
Vac / Maint / Mgmt
−$479
Net cashflow
$833/mo
Annual
$9,990/yr
Cap rate
131.17%
Cash-on-cash
445.99%
DSCR
20.84
1% rule
28.49%
Cash to close
$2,240
Investor read
- This is a 2-bed/1.0-bath single-family listed at $8k.
- At list price, monthly cash flow is $833 ($10k/yr) — positive.
- The deal already cash-flows at list — no discount required.
- Meets the 1% rule at list price ($2k rent vs $8k).
- It's been on market 23 days — a 2% lower offer ($8k) is reasonable based on typical stale-listing flexibility.
- Recommended offer: $8k (1.5% below list) — sets the bar for market timing.
- Local home prices are declining (-3.0%/yr); year-one equity from $55 of loan paydown is wiped out by about $240 of value loss. Plan a longer hold.
- Location reads 63/100 on livability (#425 in NJ) — a middle-class / working-renter tenant base. Strengths: employment A+, housing A+; Watch: schools C-, amenities F, commute F.
- Barnegat Township School District (suburban): math 23% / reading 46% proficiency, ranked #285 of 472 in NJ (top 60%) — families likely to look elsewhere, expect single-tenant / working-renter base with shorter leases.
- Watch-outs: HOA is 40% of rent.
- Market conditions: 253 active listings in the ZIP; solid renter incomes; 4,434 units permitted in Ocean County in 2024 (868 in 5+ unit buildings).
- Ocean County population projected to shrink 8% by 2050 — rents likely to lag national; underwrite the cash flow, not the appreciation.
- 2 sale attempts since 18y ago with the ask held roughly flat each time — persistent listings suggest the price (not the market) is what's stuck; bring a comps-based counter.
- At projected returns (-3.0% appreciation + 3.0% rent growth), your $2k cash investment doubles in ~1 year — after that, you're playing with house money.
- Cap rate 131.2% vs local median 3.2% in Ocean Acres — top-decile yield for the area; either an underpriced asset or a hidden risk that comps aren't pricing in. Stress-test before assuming the spread holds.
Questions for listing agent
- Built in 1978 — when were the roof, HVAC, electrical panel, plumbing, and water heater last replaced?
- What does the HOA fee cover, when was the last increase, and are there any pending special assessments or reserve-fund shortfalls?
- Is there a deadline driving the sale (1031 exchange, divorce, estate, relocation)? That informs how much negotiation room exists.
- The area grade is low — what's the realistic commute time and amenity access for the typical tenant pool here? Any planned neighborhood developments (good or bad) we should know about?
- What's the average days-on-market for RENTAL listings here right now (not sales)? A rising rental-DOM trend means longer vacancies and softer asking-rent achievability than the comps imply.
- What's the recent tenant-quality profile in this submarket — average credit score on applications, eviction rate, late-payment / NSF rate, and stable-employment percentage? A property-management company in the area should have these aggregated.
- How much new for-sale + rental construction is in the pipeline within 1–3 miles? Heavy new supply typically softens prices + rents 12–24 months out; constrained supply supports both.
CashFlowRE · CFR-M79RMMFACPS2EF
· Data 1 day ago
cashflowre.app · 2026-05-29