 🏷️ Likely Rental
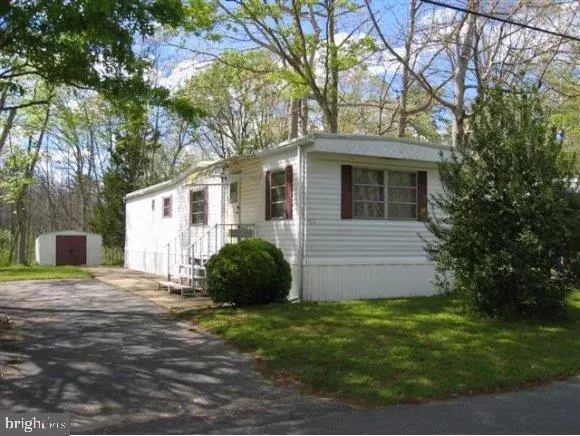
142 Chestnut · Ocean Acres, NJ
Flood risk No data
- FEMA flood zone
- —
- Chance of flooding over 30 yrs
- —
- Est. flood insurance / yr
- —
Fire risk No data
- Est. fire insurance / yr
- —
Heat risk No data
- Hot days now (above threshold)
- —
- Hot days in 30 yrs
- —
Wind risk No data
- Chance of severe wind over 30 yrs
- —
Air-quality risk No data
- Unhealthy air days now
- —
- Unhealthy air days in 30 yrs
- —
Risk factors via First Street. Map © Google.
Why this score? — see what drove the D grade
The composite is a weighted blend of 9 inputs, each scored 0–100. Each bar is that input's sub-score; the figure is the points it added to the 100-point composite (weight × sub-score).
- Cash flow +15.0/30.0
- ARV discount +7.5/15.0
- 1% rule +5.0/10.0
- DSCR +5.0/10.0
- Livability +3.2/5.0
- Schools +3.1/10.0
- Rent growth +2.5/5.0
- Condition / age +2.5/5.0
- Appreciation +0.0/10.0
$8,000
🖨 Deal sheet 📄 Offer letter ✓ Due diligence
Listing remarks MLS
Home in good condition. new refrigerator, microwave, new couch, sofa, tv. dvd player, bed, new washer and dryer, very clean and the price is right. just move in. ,Oil Tank Above Ground
Key facts
- Community pool
- Built 1978
- Listed 23 days
Property features AI
Finance
- Financial info: Monthly land lease payment of $913; 99 years of land lease remaining
- HOA & community: Monthly HOA fee of $913; HOA covers pool(s), trash, sewer, water, snow removal; Community amenities include shuffleboard, picnic area, community center, and outdoor pool
Exterior
- Parking: Driveway
- Utilities: Well water; Community septic tank
- Home design: Land lease ownership; Major rehab needed; Senior community (55+)
- Construction: Aluminum siding; Rubber roof; Crawl space foundation; Above grade structure
- Exterior features: Level lot with trees/wooded; Community in-ground pool
Interior
- Bedrooms: 2 bedrooms on the main level
- Flooring: Fully carpeted; Vinyl flooring
- Bathrooms: 1 full bathroom (main level)
- Heating & cooling: Forced air heating; Propane (leased) heating fuel; Electric hot water
- Interior features: Estimated living area; No basement
Neighborhood map
What this means for you Summary
Snapshot
- This is a 2-bed/1.0-bath single-family listed at $8k.
Deal economics
- At list price, monthly cash flow is $833 ($10k/yr) — positive.
- The deal already cash-flows at list — no discount required.
- Meets the 1% rule at list price ($2k rent vs $8k).
- Recommended offer: $8k (1.5% below list) — sets the bar for market timing.
- Cap rate 131.2% vs local median 3.2% in Ocean Acres — top-decile yield for the area; either an underpriced asset or a hidden risk that comps aren't pricing in. Stress-test before assuming the spread holds.
Location & tenants
- Location reads 63/100 on livability (#425 in NJ) — a middle-class / working-renter tenant base. Strengths: employment A+, housing A+; Watch: schools C-, amenities F, commute F.
- Barnegat Township School District (suburban): math 23% / reading 46% proficiency, ranked #285 of 472 in NJ (top 60%) — families likely to look elsewhere, expect single-tenant / working-renter base with shorter leases.
- Market conditions: 253 active listings in the ZIP; solid renter incomes; 4,434 units permitted in Ocean County in 2024 (868 in 5+ unit buildings).
Forward outlook
- Local home prices are declining (-3.0%/yr); year-one equity from $55 of loan paydown is wiped out by about $240 of value loss. Plan a longer hold.
- Ocean County population projected to shrink 8% by 2050 — rents likely to lag national; underwrite the cash flow, not the appreciation.
- At projected returns (-3.0% appreciation + 3.0% rent growth), your $2k cash investment doubles in ~1 year — after that, you're playing with house money.
Negotiation context
- It's been on market 23 days — a 2% lower offer ($8k) is reasonable based on typical stale-listing flexibility.
- 2 sale attempts since 18y ago with the ask held roughly flat each time — persistent listings suggest the price (not the market) is what's stuck; bring a comps-based counter.
Risks & watch-outs
- Watch-outs: HOA is 40% of rent.
Questions for the listing agent
- Built in 1978 — when were the roof, HVAC, electrical panel, plumbing, and water heater last replaced?
- What does the HOA fee cover, when was the last increase, and are there any pending special assessments or reserve-fund shortfalls?
- Is there a deadline driving the sale (1031 exchange, divorce, estate, relocation)? That informs how much negotiation room exists.
- The area grade is low — what's the realistic commute time and amenity access for the typical tenant pool here? Any planned neighborhood developments (good or bad) we should know about?
- What's the average days-on-market for RENTAL listings here right now (not sales)? A rising rental-DOM trend means longer vacancies and softer asking-rent achievability than the comps imply.
- What's the recent tenant-quality profile in this submarket — average credit score on applications, eviction rate, late-payment / NSF rate, and stable-employment percentage? A property-management company in the area should have these aggregated.
- How much new for-sale + rental construction is in the pipeline within 1–3 miles? Heavy new supply typically softens prices + rents 12–24 months out; constrained supply supports both.
Investment metrics
- 1% rule
- 28.49% ✓
- Cap rate
- 131.17%
- Cash-on-cash
- 445.99%
- DSCR
- 20.84
- GRM
- 0.3
CMA / ARV
- ARV (on-the-fly)
- $84,700
- Comps found
- 3
Show comp detail 3 sales within ~0.75 mi
| Address | Dist | Beds/Ba | Sqft | Sold | Price | $/sf | Match |
|---|---|---|---|---|---|---|---|
| 164 Chestnut | 0.06mi | 2/1.0 | 700 (0%) | 9mo | $85,000 | $121 | 90 |
| 141 Chestnut Dt | 0.02mi | 2/1.0 | 800 (+14%) | 3mo | $15,000 | $19 | 73 |
| 111 Pinewood Dr | 0.19mi | 2/1.0 | 758 (+8%) | 18mo | $92,000 | $121 | 62 |
Match score weights: distance 35% · size 25% · config 20% · recency 20%. Top-matched comps best support the ARV.
Projected returns pro-forma
-3.0% appreciation · 3.0% rent growth · sell at horizon
- IRR
- —
- Equity multiple
- 24.36×
- Total profit
- $52,323
- Equity at exit
- $1,193
- IRR
- —
- Equity multiple
- 52.90×
- Total profit
- $116,257
- Equity at exit
- $692
Cash invested: $2,240 (down + closing). Projections, not guarantees.
Landlord ↔ Tenant lean methodology
- Overall (STATE)
- 21 Tenant-Leaning
- State New Jersey
- 21 Tenant-Leaning · D+6
- County
- — inherits STATE
- City
- — inherits STATE
ZIP-level market 08005
- Active inventory
- 253
- Price-to-rent
- 0.3×
Monthly cashflow live
- Estimated rent
- $2,280 medium interval (Pro) →
- Mortgage (P&I)
- −$42
- Tax est. 1.5%
- −$10 /mo · $120/yr
- Insurance
- −$3
- HOA
- −$913
- Vacancy / Maint / Mgmt
- −$479
- Net cashflow
- $833
Break-even live
UW: 25.0% down · 7.5% · 30yr · 1.5% tax · 5.0% vac · 8.0% maint · 8.0% mgmt
Financing live
Cash to close
- Down payment
- $2,000
- Closing costs
- $240
- Reserves months
- —
- Total cash needed
- —
Loan-product check · same deal, 3 products live
Conventional
25% down · 7.5% · 30yr
- Down + closing
- —
- Monthly P&I
- —
- Monthly cashflow
- —
- DSCR
- —
- Eligible?
- —
Personal DTI + credit; lowest rate.
DSCR
20% down · 8.5% · 30yr
- Down + closing
- —
- Monthly P&I
- —
- Monthly cashflow
- —
- DSCR
- —
- Eligible?
- —
No personal income docs; deal must DSCR.
Hard money
10% down · 12.0% · 12mo
- Down + closing
- —
- Monthly P&I
- —
- Monthly cashflow
- —
- DSCR
- —
- Eligible?
- —
Short-term bridge; refi at stabilization.
HOA detail
- Monthly dues
- $913 · $10,956/yr
Listing history 17 events
-
2026-06-18days on market $8,000 Active 23 DOM
-
2026-06-17days on market $8,000 Active 22 DOM
-
2026-06-16days on market $8,000 Active 21 DOM
-
2026-06-15days on market $8,000 Active 20 DOM
-
2026-06-13days on market $8,000 Active 18 DOM
-
2026-06-13days on market $8,000 Active 17 DOM
-
2026-06-09days on market $8,000 Active 14 DOM
-
2026-06-08days on market $8,000 Active 13 DOM
-
2026-06-07days on market $8,000 Active 12 DOM
-
2026-06-04days on market $8,000 Active 9 DOM
-
2026-06-03days on market $8,000 Active 8 DOM
-
2026-06-02days on market $8,000 Active 7 DOM
-
2026-06-01days on market $8,000 Active 6 DOM
-
2026-05-31days on market $8,000 Active 5 DOM
-
2026-05-26$8,000 Active
-
2008-06-27soldstatus $15,000 185-char remark
Show marketing remark (185 chars)
Home in good condition. new refrigerator, microwave, new couch, sofa, tv. dvd player, bed, new washer and dryer, very clean and the price is right. just move in. ,Oil Tank Above Ground
-
2008-06-09$18,500 185-char remark
Show marketing remark (185 chars)
Home in good condition. new refrigerator, microwave, new couch, sofa, tv. dvd player, bed, new washer and dryer, very clean and the price is right. just move in. ,Oil Tank Above Ground
ⓘ Source: listings_history table (triggers on properties + properties_extension) + one-shot
backfill from property_details.listing_events for pre-trigger history.
Nearby sold comps map
Loading sold comps map…
Walkable amenities ~0.75 mi
Loading nearby amenities…
Taxation est. · year 1
- Rental income
- $27,354
- − Mortgage interest
- −$448
- − Property taxes
- −$120
- − Insurance
- −$40
- − Repairs & maintenance
- −$2,188
- − Management
- −$2,188
- − HOA
- −$10,956
- − Depreciation
- −$233
- Taxable income
- $11,181
- Est. tax owed @ 24.0%
- −$2,683
- After-tax cash flow
- $7,307/yr
For passive investors: Depreciation is non-cash, so a rental often shows a tax loss while cash-flowing — sheltering income. Rental losses are passive: they offset passive income freely, and up to $25,000/yr can offset ordinary (W-2) income if you actively participate and your MAGI is under $100k (phasing out to $0 by $150k); unused losses carry forward. On sale, claimed depreciation is recaptured at up to 25%, and gains may owe capital-gains tax (a 1031 exchange can defer both). Figures are a year-1 estimate at your 24.0% rate — not tax advice; consult a CPA.
Schools (NCES district)
- District
- Barnegat Township School District
- NCES district ID
- 3416470
- Math proficiency
- 23% ▼ -14.00%
- Reading proficiency
- 46% ▼ -5.00%
- Median HH income
- $63,645
- Composite
- 31.15/100
- National rank
- #6059
- State rank
- #285 of 472 in NJ
Livability — Ocean Acres
- Score
- 63/100
- State rank
- #425
- US rank
- #15187
Category grades
Schools grade is shown separately in the Schools card above.
Census & demographics
- County
- Ocean County · 439,426 people
- City population
- 25,936
- Metro
- New York-Newark-Jersey City, NY-NJ-PA
- Population (ZIP)
- 26,866
- Household income
- $93,584
- Rent vs Own
- Severe rent burden
- 384.0
Population outlook (Ocean County) Hauer SSP2
- Today (2025)
- 586,991 people
- By 2030
- 581,403 · -1.0%
- By 2040
- 564,913 · -3.8%
- By 2050
- 538,149 · -8.3%
- By 2075
- 468,845 · -20.1%
- By 2100
- 350,297 · -40.3%
Race, ethnicity, and origin ACS 2023
- Neighborhood character
- Predominantly White (86%)
- Race & ethnicity
- White 86% Two or more races 7% Hispanic / Latino 6% Black 3% Asian 1%
- Hispanic origin (detail)
- Puerto Rican 3%
- Common ancestry
- Romanian 9% Scotch-Irish 2% Serbian 1%
- Foreign-born
- 5% · Canada, Vietnam, China
- Languages at home
- 94% English-only · Spanish 2% Other Indo-European 1% Arabic 1%
Political lean MEDSL · Ocean
- 2024 margin
- Solid R (+36.0) · D 31.4% · R 67.4% · Other 1.2%
- 2008→2024 swing
- -17.6pp toward R · 2008: -18.4pp · 2024: -36.0pp
- All cycles
- 2024: R+36.0 2020: R+28.7 2016: R+34.0 2012: R+17.7 2008: R+18.4
Not yet ingested
- Civics
- —
Market trends
- HPI YoY
- ▼ -204.01%
- Current HPI
- 344.3189
- Rent YoY
- —
- Metro
- New York-Newark-Jersey City, NY-NJ-PA
- State GDP YoY
- ▲ 2.05%
- F500 in state
- 34
Industry mix (Fortune 500 HQ in NJ)
| Industry | F500 HQs | Revenue |
|---|---|---|
| Consumer Goods | 3 | $31B |
|
||
| Pharmaceuticals | 2 | $153B |
|
||
| Technology | 2 | $21B |
|
||
| Insurance | 2 | $20B |
|
||
| Healthcare | 2 | $19B |
|
||
| Financial Services | 1 | $70B |
|
||
Price history
-56.8% since first listed3 events — show timeline
- 2026-05-26 Listed $8,000 BRIGHT MLS
- 2008-06-27 Sold (MLS) $15,000 BRIGHT MLS
- 2008-06-09 Listed $18,500 BRIGHT MLS
Cash-flow waterfall
monthlySold comps — $/sqft
last 12 mo · ≤1 miLoading sold comps…