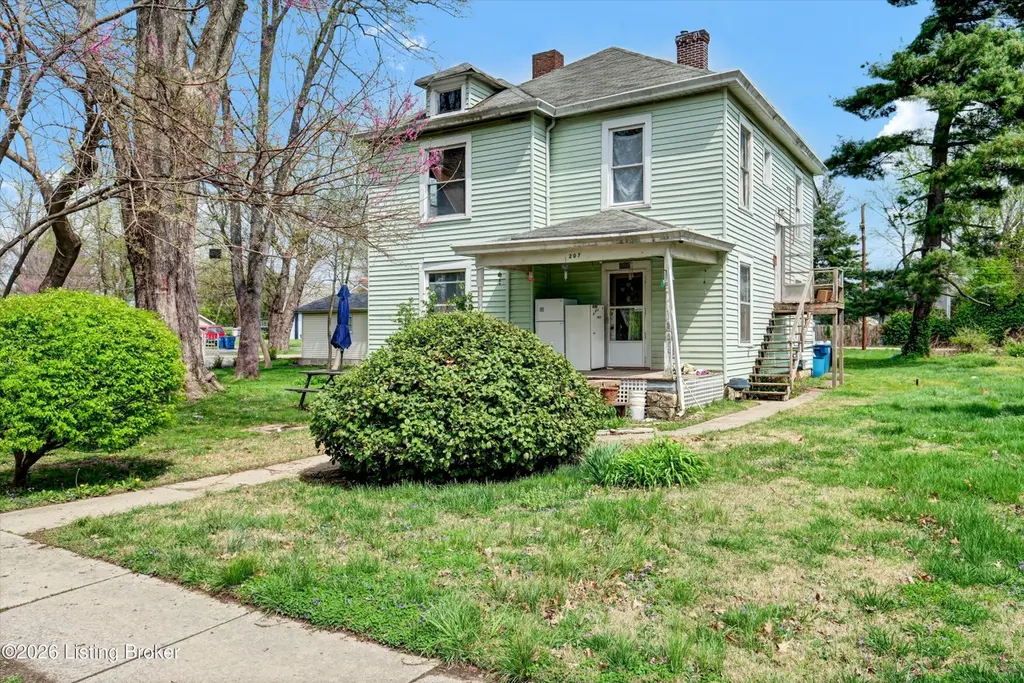
207 Birch St
La Grange, KY 40031
$189,000B
4 bd · 2.0 ba ·
1,600 sqft ·
Built 1920
· SingleFamily
· Pending
· 37 DOM
Cashflow @ list (25.0% down · 7.5%)
Estimated rent
$2,248/mo
Mortgage (P&I)
−$991
Tax + insurance
−$181
HOA
−$0
Vac / Maint / Mgmt
−$472
Net cashflow
$604/mo
Annual
$7,243/yr
Cap rate
10.13%
Cash-on-cash
13.69%
DSCR
1.61
1% rule
1.19%
Cash to close
$52,920
Investor read
- This is a 4-bed/2.0-bath single-family listed at $189k.
- At list price, monthly cash flow is $604 ($7k/yr) — positive.
- The deal already cash-flows at list — no discount required.
- Meets the 1% rule at list price ($2k rent vs $189k).
- It's been on market 37 days — a 3% lower offer ($183k) is reasonable based on typical stale-listing flexibility.
- Recommended offer: $183k (3.0% below list) — sets the bar for market timing.
- Local home prices are declining (-3.0%/yr); year-one equity from $1k of loan paydown is wiped out by about $6k of value loss. Plan a longer hold.
- Location reads 76/100 on livability (#90 in KY, #3,531 nationally) — a middle-class / working-renter tenant base. Strengths: crime A+, cost of living A+, housing A+; Watch: schools D, amenities F, commute F.
- Oldham County (suburban): math 48% / reading 55% proficiency, ranked #6 of 165 in KY (top 4%) — acceptable for families but not a draw, mixed tenant base, ~2y average lease; only 16% free/reduced lunch — higher-income household profile.
- Watch-outs: built in 1920 — expect roof / HVAC / electrical / plumbing capex.
- Market conditions: 183 active listings in the ZIP; 3 comparable units currently listed for rent nearby; rentals at typical pace (median 24d on market — plan ~3-4 weeks tenant-placement turnaround); solid renter incomes; 402 units permitted in Oldham County in 2024 (56 in 5+ unit buildings).
- Oldham County population projected at +32% by 2050 — long-run rental-demand tailwind backs the buy-and-hold thesis.
- At projected returns (-3.0% appreciation + 3.0% rent growth), your $53k cash investment doubles in ~9 years — after that, you're playing with house money.
- Cap rate 10.1% vs local median 3.3% in La Grange — top-decile yield for the area; either an underpriced asset or a hidden risk that comps aren't pricing in. Stress-test before assuming the spread holds.
Questions for listing agent
- It's been on market 37 days. Have you received any prior offers? Is the seller open to a 3% concession, seller financing, or rate buy-down credit?
- Built in 1920 — when were the roof, HVAC, electrical panel, plumbing, and water heater last replaced?
- Is there a deadline driving the sale (1031 exchange, divorce, estate, relocation)? That informs how much negotiation room exists.
- Schools are D-rated, which usually means shorter tenancies and higher turnover. Who's the typical renter profile here, and what's been the actual vacancy rate?
- What's the average days-on-market for RENTAL listings here right now (not sales)? A rising rental-DOM trend means longer vacancies and softer asking-rent achievability than the comps imply.
- What's the recent tenant-quality profile in this submarket — average credit score on applications, eviction rate, late-payment / NSF rate, and stable-employment percentage? A property-management company in the area should have these aggregated.
- How much new for-sale + rental construction is in the pipeline within 1–3 miles? Heavy new supply typically softens prices + rents 12–24 months out; constrained supply supports both.
CashFlowRE · CFR-M79V8BCZT4R4FG
· Data 3 weeks ago
cashflowre.app · 2026-05-29