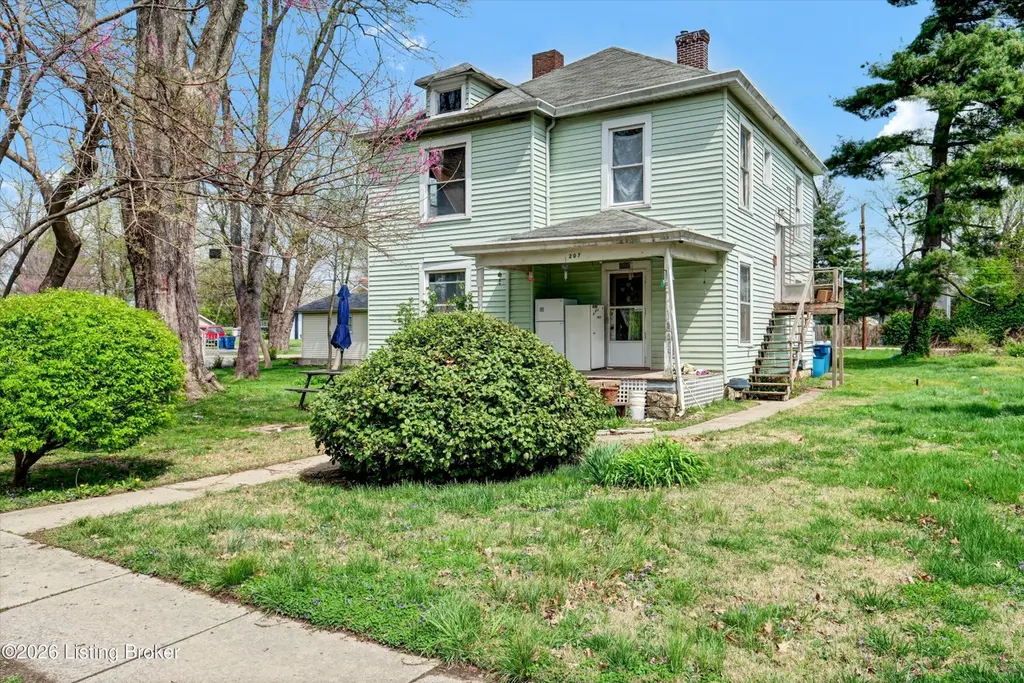
207 Birch St · La Grange, KY
Flood risk 1/10 · Minimal
- FEMA flood zone
- X (unshaded)
- Chance of flooding over 30 yrs
- 0.0%
- Est. flood insurance / yr
- $507 – $1,088
Fire risk 3/10 · Minor
- Est. fire insurance / yr
- $839 – $1,559
Heat risk 4/10 · Minor
- Hot days now (above 104°F)
- 7 days/yr
- Hot days in 30 yrs
- 20 days/yr
Wind risk 2/10 · Minimal
- Chance of severe wind over 30 yrs
- 2.0%
Air-quality risk 2/10 · Minimal
- Unhealthy air days now
- 1 days/yr
- Unhealthy air days in 30 yrs
- 2 days/yr
Risk factors via First Street. Map © Google.
Why this score? — see what drove the B grade
The composite is a weighted blend of 9 inputs, each scored 0–100. Each bar is that input's sub-score; the figure is the points it added to the 100-point composite (weight × sub-score).
- Cash flow +28.3/30.0
- ARV discount +15.0/15.0
- DSCR +10.0/10.0
- 1% rule +6.9/10.0
- Schools +4.7/10.0
- Livability +3.8/5.0
- Rent growth +2.5/5.0
- Condition / age +2.5/5.0
- Appreciation +0.0/10.0
$189,000
🖨 Deal sheet 📄 Offer letter ✓ Due diligence
Listing remarks MLS
Investor special in desirable La Grange located in highly sought-after Oldham County. This 4 bed, 2 bath property is currently configured as a duplex but offers the highest and best use as a single-family home. Perfect fixer-upper for investors or buyers looking to add value. Tons of upside, strong location, and a great opportunity to create equity.
Key facts
- 0.3 acre lot
- Built 1920
- Listed 37 days
Neighborhood map
What this means for you Summary
Snapshot
- This is a 4-bed/2.0-bath single-family listed at $189k.
Deal economics
- At list price, monthly cash flow is $604 ($7k/yr) — positive.
- The deal already cash-flows at list — no discount required.
- Meets the 1% rule at list price ($2k rent vs $189k).
- Recommended offer: $183k (3.0% below list) — sets the bar for market timing.
- Cap rate 10.1% vs local median 3.3% in La Grange — top-decile yield for the area; either an underpriced asset or a hidden risk that comps aren't pricing in. Stress-test before assuming the spread holds.
Location & tenants
- Location reads 76/100 on livability (#90 in KY, #3,531 nationally) — a middle-class / working-renter tenant base. Strengths: crime A+, cost of living A+, housing A+; Watch: schools D, amenities F, commute F.
- Oldham County (suburban): math 48% / reading 55% proficiency, ranked #6 of 165 in KY (top 4%) — acceptable for families but not a draw, mixed tenant base, ~2y average lease; only 16% free/reduced lunch — higher-income household profile.
- Market conditions: 183 active listings in the ZIP; 3 comparable units currently listed for rent nearby; rentals at typical pace (median 24d on market — plan ~3-4 weeks tenant-placement turnaround); solid renter incomes; 402 units permitted in Oldham County in 2024 (56 in 5+ unit buildings).
Forward outlook
- Local home prices are declining (-3.0%/yr); year-one equity from $1k of loan paydown is wiped out by about $6k of value loss. Plan a longer hold.
- Oldham County population projected at +32% by 2050 — long-run rental-demand tailwind backs the buy-and-hold thesis.
- At projected returns (-3.0% appreciation + 3.0% rent growth), your $53k cash investment doubles in ~9 years — after that, you're playing with house money.
Negotiation context
- It's been on market 37 days — a 3% lower offer ($183k) is reasonable based on typical stale-listing flexibility.
Risks & watch-outs
- Watch-outs: built in 1920 — expect roof / HVAC / electrical / plumbing capex.
Questions for the listing agent
- It's been on market 37 days. Have you received any prior offers? Is the seller open to a 3% concession, seller financing, or rate buy-down credit?
- Built in 1920 — when were the roof, HVAC, electrical panel, plumbing, and water heater last replaced?
- Is there a deadline driving the sale (1031 exchange, divorce, estate, relocation)? That informs how much negotiation room exists.
- Schools are D-rated, which usually means shorter tenancies and higher turnover. Who's the typical renter profile here, and what's been the actual vacancy rate?
- What's the average days-on-market for RENTAL listings here right now (not sales)? A rising rental-DOM trend means longer vacancies and softer asking-rent achievability than the comps imply.
- What's the recent tenant-quality profile in this submarket — average credit score on applications, eviction rate, late-payment / NSF rate, and stable-employment percentage? A property-management company in the area should have these aggregated.
- How much new for-sale + rental construction is in the pipeline within 1–3 miles? Heavy new supply typically softens prices + rents 12–24 months out; constrained supply supports both.
Investment metrics
- 1% rule
- 1.19% ✓
- Cap rate
- 10.13%
- Cash-on-cash
- 13.69%
- DSCR
- 1.61
- GRM
- 7.0
CMA / ARV
- ARV (median comp)
- $285,605
- List price
- $189,000
- Delta
- -33.82%
- Verdict
- UNDERPRICED
- Comps
- 20 within 1.0 mi
Show comp detail 12 sales within ~0.75 mi
| Address | Dist | Beds/Ba | Sqft | Sold | Price | $/sf | Match |
|---|---|---|---|---|---|---|---|
| 207 Birch St | 0.00mi | 4/2.0 | 1,600 (0%) | 1mo | $170,000 | $106 | 99 |
| 917 Woodland Ridge Cir | 0.27mi | 3/2.0 (-1) | 1,602 (+0%) | 8mo | $313,800 | $196 | 76 |
| 920 Woodland Ridge Cir | 0.24mi | 3/2.0 (-1) | 1,540 (-4%) | 4mo | $312,000 | $203 | 74 |
| 1617 Hopkins Ct | 0.34mi | 3/2.0 (-1) | 1,502 (-6%) | 0mo | $240,000 | $160 | 69 |
| 1600 Acosta Ct | 0.38mi | 3/2.0 (-1) | 1,591 (-1%) | 11mo | $267,000 | $168 | 67 |
| 1500 Walkerwood Ct | 0.46mi | 4/2.0 | 1,500 (-6%) | 8mo | $302,000 | $201 | 61 |
| 209 N Cedar St | 0.32mi | 4/2.5 | 1,754 (+10%) | 9mo | $353,000 | $201 | 60 |
| 708 Lakeview Ave | 0.46mi | 3/1.5 (-1) | 1,531 (-4%) | 6mo | $240,000 | $157 | 60 |
| 1706 Cypress Ct | 0.74mi | 4/2.0 | 1,525 (-5%) | 2mo | $260,000 | $170 | 55 |
| 204 E Madison St | 0.35mi | 3/2.0 (-1) | 1,760 (+10%) | 12mo | $319,000 | $181 | 52 |
| 1218 Cedar Springs Pkwy | 0.65mi | 3/2.0 (-1) | 1,485 (-7%) | 1mo | $285,000 | $192 | 52 |
| 1308 Cedar Springs Pkwy | 0.73mi | 3/2.5 (-1) | 1,728 (+8%) | 9mo | $299,000 | $173 | 38 |
Match score weights: distance 35% · size 25% · config 20% · recency 20%. Top-matched comps best support the ARV.
Projected returns pro-forma
-3.0% appreciation · 3.0% rent growth · sell at horizon
- IRR
- 3.8%
- Equity multiple
- 1.15×
- Total profit
- $7,769
- Equity at exit
- $28,181
- IRR
- 13.3%
- Equity multiple
- 2.06×
- Total profit
- $56,072
- Equity at exit
- $16,341
Cash invested: $52,920 (down + closing). Projections, not guarantees.
Landlord ↔ Tenant lean methodology
- Overall (STATE)
- 83 Strongly Landlord-Friendly
- State Kentucky
- 83 Strongly Landlord-Friendly · R+16
- County
- — inherits STATE
- City
- — inherits STATE
ZIP-level market 40031
- Active inventory
- 183
- Price-to-rent
- 7.0×
Monthly cashflow live
- Estimated rent
- $2,248 medium interval (Pro) →
- Mortgage (P&I)
- −$991
- Tax from tax record
- −$102 /mo · $1,230/yr
- Insurance
- −$79
- HOA
- −$0
- Vacancy / Maint / Mgmt
- −$472
- Net cashflow
- $604
Break-even live
UW: 25.0% down · 7.5% · 30yr · 1.5% tax · 5.0% vac · 8.0% maint · 8.0% mgmt
Financing live
Cash to close
- Down payment
- $47,250
- Closing costs
- $5,670
- Reserves months
- —
- Total cash needed
- —
Loan-product check · same deal, 3 products live
Conventional
25% down · 7.5% · 30yr
- Down + closing
- —
- Monthly P&I
- —
- Monthly cashflow
- —
- DSCR
- —
- Eligible?
- —
Personal DTI + credit; lowest rate.
DSCR
20% down · 8.5% · 30yr
- Down + closing
- —
- Monthly P&I
- —
- Monthly cashflow
- —
- DSCR
- —
- Eligible?
- —
No personal income docs; deal must DSCR.
Hard money
10% down · 12.0% · 12mo
- Down + closing
- —
- Monthly P&I
- —
- Monthly cashflow
- —
- DSCR
- —
- Eligible?
- —
Short-term bridge; refi at stabilization.
Rent comps 3 comps
| Address | Beds | Baths | Sqft | Rent | $/sqft | DOM | Units | Dist |
|---|---|---|---|---|---|---|---|---|
| 313 Stamper Ave La Grange, KY | 3.0 | 2.0 | 1300 | $2,050 | $1.58 | 23d | 1 | 0.18mi |
| 1908 Jericho Rd Unit F6 La Grange, KY | 3.0 | 1.5 | 1050 | $1,350 | $1.29 | 43d | 1 | 0.70mi |
| 1908 Jericho Rd La Grange, KY | 2.0–3.0 | 1.0–1.5 | 1000 | $1,340 | $1.34 | 1d | 3 | 0.70mi |
Listing history 3 events
-
2026-05-12status Pending 351-char remark
Show marketing remark (351 chars)
Investor special in desirable La Grange located in highly sought-after Oldham County. This 4 bed, 2 bath property is currently configured as a duplex but offers the highest and best use as a single-family home. Perfect fixer-upper for investors or buyers looking to add value. Tons of upside, strong location, and a great opportunity to create equity.
-
2026-04-13price $189,000 351-char remark
Show marketing remark (351 chars)
Investor special in desirable La Grange located in highly sought-after Oldham County. This 4 bed, 2 bath property is currently configured as a duplex but offers the highest and best use as a single-family home. Perfect fixer-upper for investors or buyers looking to add value. Tons of upside, strong location, and a great opportunity to create equity.
-
2026-04-05$199,000 Active 351-char remark
Show marketing remark (351 chars)
Investor special in desirable La Grange located in highly sought-after Oldham County. This 4 bed, 2 bath property is currently configured as a duplex but offers the highest and best use as a single-family home. Perfect fixer-upper for investors or buyers looking to add value. Tons of upside, strong location, and a great opportunity to create equity.
ⓘ Source: listings_history table (triggers on properties + properties_extension) + one-shot
backfill from property_details.listing_events for pre-trigger history.
Tax reassessment forecast KY · Resets to sale price
- Current annual tax
- $1,230 · $102/mo
- Projected year-2 tax
- $1,625 · $135/mo
- Expected delta
- +$395/yr (+$33/mo · 32.2%)
ⓘ Screening estimate from a state-policy table — verify with the county assessor before closing.
Climate risk First Street
- Flood 1/10 Low FEMA zone X (unshaded) · 0% chance over 30 yrs
- Wildfire 3/10 Moderate
- Heat 4/10 Moderate 7 d/yr ≥104°F today · 20 d/yr by 30 yrs out
- Wind 2/10 Low 2% chance of damaging wind over 30 yrs
- Air quality 2/10 Low 1 unhealthy d/yr today · 2 by 30 yrs out
Nearby sold comps map
Loading sold comps map…
Walkable amenities ~0.75 mi
Loading nearby amenities…
Taxation est. · year 1
- Rental income
- $26,977
- − Mortgage interest
- −$10,587
- − Property taxes
- −$1,230
- − Insurance
- −$945
- − Repairs & maintenance
- −$2,158
- − Management
- −$2,158
- − Depreciation
- −$5,498
- Taxable income
- $4,401
- Est. tax owed @ 24.0%
- −$1,056
- After-tax cash flow
- $6,187/yr
For passive investors: Depreciation is non-cash, so a rental often shows a tax loss while cash-flowing — sheltering income. Rental losses are passive: they offset passive income freely, and up to $25,000/yr can offset ordinary (W-2) income if you actively participate and your MAGI is under $100k (phasing out to $0 by $150k); unused losses carry forward. On sale, claimed depreciation is recaptured at up to 25%, and gains may owe capital-gains tax (a 1031 exchange can defer both). Figures are a year-1 estimate at your 24.0% rate — not tax advice; consult a CPA.
Schools (NCES district)
- District
- Oldham County
- NCES district ID
- 2104530
- Math proficiency
- 48% ▼ -15.00%
- Reading proficiency
- 55% ▼ -14.00%
- Median HH income
- $84,329
- Composite
- 47.29/100
- National rank
- #2303
- State rank
- #6 of 165 in KY
Livability — La Grange
- Score
- 76/100
- State rank
- #90
- US rank
- #3531
Category grades
Schools grade is shown separately in the Schools card above.
Census & demographics
- Census place
- La Grange, KY
- County
- Oldham County · 49,360 people
- City population
- 26,259
- Metro
- Louisville/Jefferson County, KY-IN
- Population (ZIP)
- 26,259
- Household income
- $98,513
- Rent vs Own
- Severe rent burden
- 214.0
Population outlook (Oldham County) Hauer SSP2
- Today (2025)
- 75,661 people
- By 2030
- 80,948 · +7.0%
- By 2040
- 90,894 · +20.1%
- By 2050
- 100,168 · +32.4%
- By 2075
- 123,605 · +63.4%
- By 2100
- 133,523 · +76.5%
Race, ethnicity, and origin ACS 2023
- Neighborhood character
- Predominantly White (84%)
- Race & ethnicity
- White 84% Two or more races 6% Black 6% Hispanic / Latino 5%
- Hispanic origin (detail)
- Mexican 3% Puerto Rican 1%
- Common ancestry
- Lithuanian 2% Romanian 2% Italian 2%
- Foreign-born
- 4% · Canada
- Languages at home
- 94% English-only · Spanish 4%
Political lean MEDSL · Oldham
- 2024 margin
- Strong R (+22.6) · D 37.7% · R 60.3% · Other 2.0%
- 2008→2024 swing
- +8.1pp toward D · 2008: -30.7pp · 2024: -22.6pp
- All cycles
- 2024: R+22.6 2020: R+21.4 2016: R+31.1 2012: R+36.6 2008: R+30.7
Not yet ingested
- Civics
- —
Market trends
- HPI YoY
- ▼ -169.32%
- Current HPI
- 227.4645
- Rent YoY
- —
- Metro
- Louisville/Jefferson County, KY-IN
- State GDP YoY
- ▲ 1.81%
- F500 in state
- 4
Industry mix (Fortune 500 HQ in KY)
| Industry | F500 HQs | Revenue |
|---|---|---|
| Healthcare | 1 | $118B |
|
||
| Food / Beverage | 1 | $7B |
|
||
Price history
-5.0% since first listed3 events — show timeline
- 2026-05-12 Pending — Metro Search MLS
- 2026-04-13 Price Changed $189,000 Metro Search MLS
- 2026-04-05 Listed $199,000 Metro Search MLS
Property tax history
+7.9%/yrLatest (2025): $1,230 · +85.7% YoY. Source: county tax records.
Cash-flow waterfall
monthlySold comps — $/sqft
last 12 mo · ≤1 miLoading sold comps…