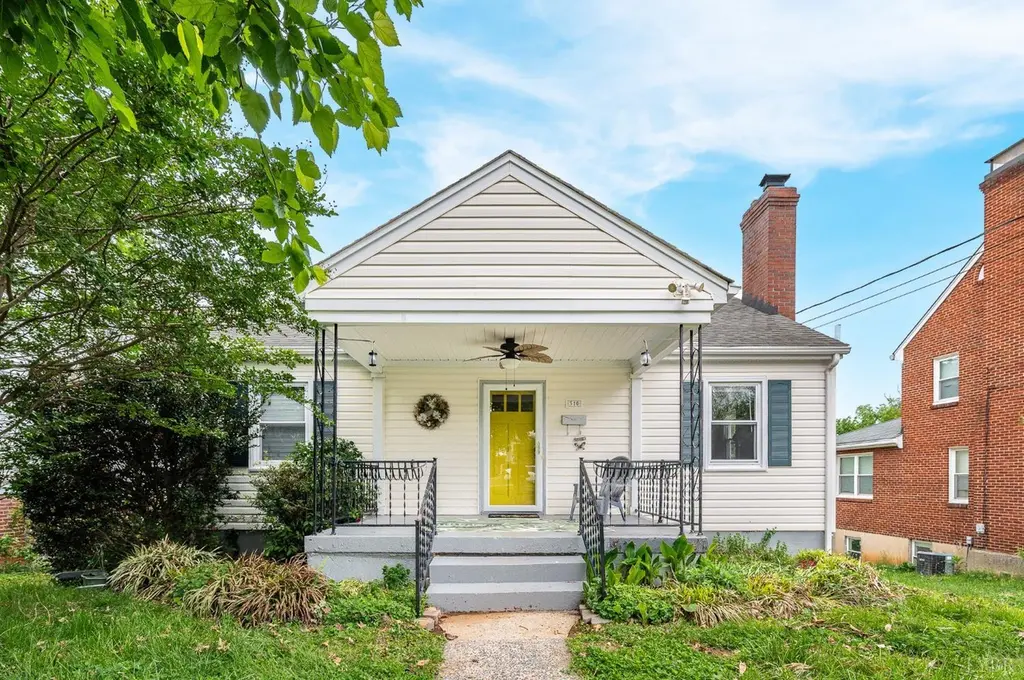
310 Langhorne Ln
Lynchburg, VA 24501
$210,000D-
2 bd · 1.0 ba ·
1,217 sqft ·
Built 1948
· SingleFamily
· Pending
· 2 DOM
Cashflow @ list (25.0% down · 7.5%)
Estimated rent
$1,223/mo
Mortgage (P&I)
−$1,101
Tax + insurance
−$230
HOA
−$0
Vac / Maint / Mgmt
−$257
Net cashflow
$-365/mo
Annual
$-4,376/yr
Cap rate
4.21%
Cash-on-cash
-7.44%
DSCR
0.67
1% rule
0.58%
Cash to close
$58,800
Investor read
- This is a 2-bed/1.0-bath single-family listed at $210k.
- At list price, monthly cash flow is $-365 ($-4k/yr) — negative.
- To cash-flow at today's rent, offer at most $146k (30.7% below list).
- To meet the 1% rule (rent ≥ 1% of price), the offer needs to be $122k (41.7% below list).
- Only 2 days on market — expect competitive offers; lowballing is unlikely to land.
- Recommended offer: $122k (41.7% below list) — sets the bar for 1% rule.
- Local home prices are declining (-3.0%/yr); year-one equity from $1k of loan paydown is wiped out by about $6k of value loss. Plan a longer hold.
- Location reads 91/100 on livability (#1 in VA, #58 nationally) — a professional / high-income tenant draw. Strengths: amenities A+, commute A+, cost of living A+; Watch: crime C-, employment D+.
- Lynchburg City Public School District (urban): math 36% / reading 61% proficiency, ranked #104 of 131 in VA (top 79%) — families likely to look elsewhere, expect single-tenant / working-renter base with shorter leases; 61% free/reduced lunch — lower-income household profile, screen leases tightly.
- Watch-outs: built in 1948 — expect roof / HVAC / electrical / plumbing capex.
- Market conditions: Rents rising (+1.1%/yr); 216 active listings in the ZIP; 36 comparable units currently listed for rent nearby; rentals at typical pace (median 21d on market — plan ~3-4 weeks tenant-placement turnaround); 44% of comp listings sitting > 30 days — soft ceiling on asking rent; lower-income renter base — watch delinquency; 472 units permitted in Lynchburg city in 2024 (240 in 5+ unit buildings).
- Lynchburg County population projected at +37% by 2050 — long-run rental-demand tailwind backs the buy-and-hold thesis.
- 5 sale attempts since 12y ago with the ask held roughly flat each time — persistent listings suggest the price (not the market) is what's stuck; bring a comps-based counter.
- Climate carrying-cost: extreme-heat days projected 7→18/yr by 2055 (HVAC capex compounding) — expect insurance premiums to compound above CPI over the hold.
- This rent runs 35% of the median local income ($42k/yr) — at the standard rent-burdened threshold; future hikes will face affordability resistance.
Questions for listing agent
- What do current leases actually rent for vs. the listed asking? Can we see a recent rent roll and the last 12 months of T-12 income?
- Built in 1948 — when were the roof, HVAC, electrical panel, plumbing, and water heater last replaced?
- Is there a deadline driving the sale (1031 exchange, divorce, estate, relocation)? That informs how much negotiation room exists.
- Schools are A-rated — typically a magnet for longer-tenancy family renters. What's the average tenant stay here, and is there a school-zone premium baked into asking?
- The area grade is low — what's the realistic commute time and amenity access for the typical tenant pool here? Any planned neighborhood developments (good or bad) we should know about?
- What's the average days-on-market for RENTAL listings here right now (not sales)? A rising rental-DOM trend means longer vacancies and softer asking-rent achievability than the comps imply.
- What's the recent tenant-quality profile in this submarket — average credit score on applications, eviction rate, late-payment / NSF rate, and stable-employment percentage? A property-management company in the area should have these aggregated.
- How much new for-sale + rental construction is in the pipeline within 1–3 miles? Heavy new supply typically softens prices + rents 12–24 months out; constrained supply supports both.
CashFlowRE · CFR-M9T6985MCF89GG
· Data 3 weeks ago
cashflowre.app · 2026-05-29