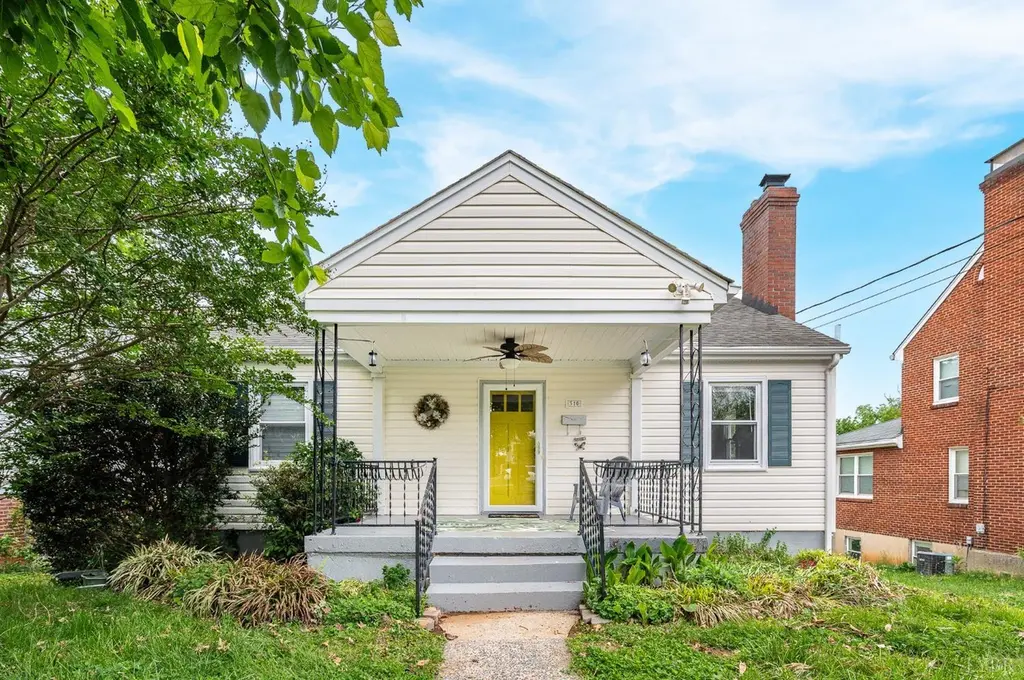
310 Langhorne Ln · Lynchburg, VA
Flood risk 1/10 · Minimal
- FEMA flood zone
- X (unshaded)
- Chance of flooding over 30 yrs
- 0.0%
- Est. flood insurance / yr
- $473 – $860
Fire risk 2/10 · Minimal
- Est. fire insurance / yr
- $666 – $1,236
Heat risk 6/10 · Moderate
- Hot days now (above 101°F)
- 7 days/yr
- Hot days in 30 yrs
- 18 days/yr
Wind risk 2/10 · Minimal
- Chance of severe wind over 30 yrs
- 3.0%
Air-quality risk 2/10 · Minimal
- Unhealthy air days now
- 0 days/yr
- Unhealthy air days in 30 yrs
- 1 days/yr
Risk factors via First Street. Map © Google.
Why this score? — see what drove the D- grade
The composite is a weighted blend of 9 inputs, each scored 0–100. Each bar is that input's sub-score; the figure is the points it added to the 100-point composite (weight × sub-score).
- ARV discount +15.0/15.0
- Cash flow +6.4/30.0
- Livability +4.5/5.0
- Schools +4.0/10.0
- Rent growth +2.8/5.0
- Condition / age +2.5/5.0
- 1% rule +0.8/10.0
- DSCR +0.7/10.0
- Appreciation +0.0/10.0
$210,000
🖨 Deal sheet 📄 Offer letter ✓ Due diligence
Listing remarks MLS
Charming home in the heart of Lynchburg! This adorable 3 bedroom, 2 bath home offers character and convenience. Inside you'll find hardwood floors, spacious rooms, replacement windows and a welcoming layout. The basement adds incredible flexibility with a laundry area, home office, and additional finished rooms ideal for guests, hobbies, or extra living space. A walk-up attic offers even more potential for future expansion. Outside, enjoy a large fenced backyard perfect for kids and pets, off-street parking, and a detached one car garage. Convenient to local colleges, shopping and dining.
Key facts
- Finished rooms
- Laundry area
- Walk-up attic
Tags
Property features AI
Exterior
- Parking: 1 covered parking space
- Utilities: Has heating; Has cooling
- Home design: Residential property; Built in 1948
- Construction: Built in 1948
- Exterior features: 0.38 acre lot
Interior
- Bedrooms: 3 bedrooms total; 2 bedrooms on the main level
- Flooring: Concrete; Vinyl; Wood
- Bathrooms: 2 full bathrooms; 1 bathroom on the main level
- Heating & cooling: Heat pump (electric) cooling/heating; Forced air oil heating
- Interior features: 7 total rooms; Concrete, vinyl, and wood flooring; One fireplace
Neighborhood map
What this means for you Summary
Snapshot
- This is a 2-bed/1.0-bath single-family listed at $210k.
Deal economics
- At list price, monthly cash flow is $-365 ($-4k/yr) — negative.
- To cash-flow at today's rent, offer at most $146k (30.7% below list).
- To meet the 1% rule (rent ≥ 1% of price), the offer needs to be $122k (41.7% below list).
- Recommended offer: $122k (41.7% below list) — sets the bar for 1% rule.
Location & tenants
- Location reads 91/100 on livability (#1 in VA, #58 nationally) — a professional / high-income tenant draw. Strengths: amenities A+, commute A+, cost of living A+; Watch: crime C-, employment D+.
- Lynchburg City Public School District (urban): math 36% / reading 61% proficiency, ranked #104 of 131 in VA (top 79%) — families likely to look elsewhere, expect single-tenant / working-renter base with shorter leases; 61% free/reduced lunch — lower-income household profile, screen leases tightly.
- Market conditions: Rents rising (+1.1%/yr); 216 active listings in the ZIP; 36 comparable units currently listed for rent nearby; rentals at typical pace (median 21d on market — plan ~3-4 weeks tenant-placement turnaround); 44% of comp listings sitting > 30 days — soft ceiling on asking rent; lower-income renter base — watch delinquency; 472 units permitted in Lynchburg city in 2024 (240 in 5+ unit buildings).
- This rent runs 35% of the median local income ($42k/yr) — at the standard rent-burdened threshold; future hikes will face affordability resistance.
Forward outlook
- Local home prices are declining (-3.0%/yr); year-one equity from $1k of loan paydown is wiped out by about $6k of value loss. Plan a longer hold.
- Lynchburg County population projected at +37% by 2050 — long-run rental-demand tailwind backs the buy-and-hold thesis.
Negotiation context
- Only 2 days on market — expect competitive offers; lowballing is unlikely to land.
- 5 sale attempts since 12y ago with the ask held roughly flat each time — persistent listings suggest the price (not the market) is what's stuck; bring a comps-based counter.
Risks & watch-outs
- Watch-outs: built in 1948 — expect roof / HVAC / electrical / plumbing capex.
- Climate carrying-cost: extreme-heat days projected 7→18/yr by 2055 (HVAC capex compounding) — expect insurance premiums to compound above CPI over the hold.
Questions for the listing agent
- What do current leases actually rent for vs. the listed asking? Can we see a recent rent roll and the last 12 months of T-12 income?
- Built in 1948 — when were the roof, HVAC, electrical panel, plumbing, and water heater last replaced?
- Is there a deadline driving the sale (1031 exchange, divorce, estate, relocation)? That informs how much negotiation room exists.
- Schools are A-rated — typically a magnet for longer-tenancy family renters. What's the average tenant stay here, and is there a school-zone premium baked into asking?
- The area grade is low — what's the realistic commute time and amenity access for the typical tenant pool here? Any planned neighborhood developments (good or bad) we should know about?
- What's the average days-on-market for RENTAL listings here right now (not sales)? A rising rental-DOM trend means longer vacancies and softer asking-rent achievability than the comps imply.
- What's the recent tenant-quality profile in this submarket — average credit score on applications, eviction rate, late-payment / NSF rate, and stable-employment percentage? A property-management company in the area should have these aggregated.
- How much new for-sale + rental construction is in the pipeline within 1–3 miles? Heavy new supply typically softens prices + rents 12–24 months out; constrained supply supports both.
Investment metrics
- 1% rule
- 0.58% ✗
- Cap rate
- 4.21%
- Cash-on-cash
- -7.44%
- DSCR
- 0.67
- GRM
- 14.3
CMA / ARV
- ARV (median comp)
- $271,250
- List price
- $210,000
- Delta
- -22.58%
- Verdict
- UNDERPRICED
- Comps
- 20 within 1.0 mi
Show comp detail 12 sales within ~0.75 mi
| Address | Dist | Beds/Ba | Sqft | Sold | Price | $/sf | Match |
|---|---|---|---|---|---|---|---|
| 263 Bell St | 0.14mi | 2/1.0 | 1,322 (+9%) | 2mo | $155,000 | $117 | 78 |
| 801 Sommers St | 0.43mi | 2/1.0 | 1,240 (+2%) | 4mo | $160,000 | $129 | 74 |
| 3206 Memorial Ave | 0.26mi | 3/1.0 (+1) | 1,212 (-0%) | 11mo | $119,000 | $98 | 73 |
| 319 Oakridge Blvd | 0.40mi | 2/1.0 | 1,162 (-4%) | 2mo | $165,800 | $143 | 72 |
| 211 Warren Ave Ave | 0.21mi | 3/1.0 (+1) | 1,133 (-7%) | 5mo | $175,000 | $154 | 70 |
| 3201 Cary St | 0.26mi | 2/1.0 | 1,336 (+10%) | 6mo | $187,900 | $141 | 66 |
| 517 Eldon St | 0.19mi | 3/1.0 (+1) | 1,336 (+10%) | 9mo | $210,000 | $157 | 63 |
| 3204 Richmond St | 0.14mi | 3/1.0 (+1) | 1,380 (+13%) | 11mo | $157,500 | $114 | 57 |
| 423 Westover Blvd | 0.24mi | 3/2.0 (+1) | 1,340 (+10%) | 8mo | $251,500 | $188 | 56 |
| 505 Thomas Rd Rd | 0.47mi | 2/1.0 | 1,087 (-11%) | 6mo | $120,000 | $110 | 56 |
| 609 Hood St | 0.48mi | 2/1.0 | 1,395 (+15%) | 6mo | $169,900 | $122 | 48 |
| 325 Saint Augustine St | 0.63mi | 3/1.0 (+1) | 1,113 (-8%) | 4mo | $189,900 | $171 | 48 |
Match score weights: distance 35% · size 25% · config 20% · recency 20%. Top-matched comps best support the ARV.
Projected returns pro-forma
-3.0% appreciation · 1.15% rent growth · sell at horizon
- IRR
- -31.2%
- Equity multiple
- -0.01×
- Total profit
- $-59,547
- Equity at exit
- $31,312
- IRR
- -44.5%
- Equity multiple
- -0.54×
- Total profit
- $-90,826
- Equity at exit
- $18,157
Cash invested: $58,800 (down + closing). Projections, not guarantees.
Landlord ↔ Tenant lean methodology
- Overall (STATE)
- 55 Moderately Landlord-Leaning
- State Virginia
- 55 Moderately Landlord-Leaning · D+2
- County
- — inherits STATE
- City
- — inherits STATE
ZIP-level market 24501
- Rents YoY
- 1.1%
- Active inventory
- 216
- Price-to-rent
- 14.3×
Monthly cashflow live
- Estimated rent
- $1,223 high interval (Pro) →
- Mortgage (P&I)
- −$1,101
- Tax from tax record
- −$142 /mo · $1,709/yr
- Insurance
- −$88
- HOA
- −$0
- Vacancy / Maint / Mgmt
- −$257
- Net cashflow
- $-365
Break-even live
UW: 25.0% down · 7.5% · 30yr · 1.5% tax · 5.0% vac · 8.0% maint · 8.0% mgmt
Financing live
Cash to close
- Down payment
- $52,500
- Closing costs
- $6,300
- Reserves months
- —
- Total cash needed
- —
Loan-product check · same deal, 3 products live
Conventional
25% down · 7.5% · 30yr
- Down + closing
- —
- Monthly P&I
- —
- Monthly cashflow
- —
- DSCR
- —
- Eligible?
- —
Personal DTI + credit; lowest rate.
DSCR
20% down · 8.5% · 30yr
- Down + closing
- —
- Monthly P&I
- —
- Monthly cashflow
- —
- DSCR
- —
- Eligible?
- —
No personal income docs; deal must DSCR.
Hard money
10% down · 12.0% · 12mo
- Down + closing
- —
- Monthly P&I
- —
- Monthly cashflow
- —
- DSCR
- —
- Eligible?
- —
Short-term bridge; refi at stabilization.
Rent comps 36 comps
| Address | Beds | Baths | Sqft | Rent | $/sqft | DOM | Units | Dist |
|---|---|---|---|---|---|---|---|---|
| 106 Yeardley Ave Unit B Lynchburg, VA | 3.0 | 1.0 | 1060 | $895 | $0.84 | 21d | 1 | 0.23mi |
| 803 Mansfield Ave Lynchburg, VA | 2.0 | 1.0 | 900 | $1,300 | $1.44 | 21d | 1 | 0.37mi |
| 216 Kenyon St Lynchburg, VA | 2.0 | 1.0 | 1114 | $995 | $0.89 | 43d | 1 | 0.53mi |
| 540 Monticello Ave Unit B Lynchburg, VA | 2.0 | 1.0 | 900 | $995 | $1.11 | 21d | 1 | 0.62mi |
| 905 Centerdale St Lynchburg, VA | 2.0 | 1.0 | 780 | $895 | $1.15 | 13d | 1 | 0.67mi |
| 4067 Fort Ave Unit 3 Lynchburg, VA | 2.0 | 1.0 | 950 | $995 | $1.05 | 21d | 1 | 0.67mi |
| 2734 Fort Ave Lynchburg, VA | 1.0–2.0 | 1.0–2.0 | 875 | $1,450 | $1.66 | 43d | 1 | 0.72mi |
| 1218 Shirley Rd Lynchburg, VA | 2.0 | 1.0 | 742 | $950 | $1.28 | 21d | 1 | 0.73mi |
| 318 Wadsworth St Lynchburg, VA | 3.0 | 1.0 | 943 | $995 | $1.06 | 21d | 1 | 0.75mi |
| 317 Grove St Unit A Lynchburg, VA | 2.0 | 1.0 | 900 | $895 | $0.99 | 43d | 1 | 0.77mi |
| 4300 Tremont St Lynchburg, VA | 3.0 | 1.0 | 1122 | $1,200 | $1.07 | 43d | 1 | 0.78mi |
| 403 Grove St Lynchburg, VA | 3.0 | 2.0 | 1400 | $1,600 | $1.14 | 43d | 1 | 0.80mi |
| 1320 Saint Cloud Ave Lynchburg, VA | 3.0 | 1.0 | 960 | $1,550 | $1.61 | 44d | 1 | 0.88mi |
| 1625 Shaffer St Lynchburg, VA | 2.0 | 1.0 | 895 | $850 | $0.95 | 43d | 1 | 0.92mi |
| 1810 Broadway St #112 Lynchburg, VA | 2.0 | 2.5 | 1210 | $1,600 | $1.32 | 43d | 1 | 0.93mi |
| 2107 Park Ave Unit 4 Lynchburg, VA | 2.0 | 1.0 | 800 | $785 | $0.98 | 13d | 1 | 0.95mi |
| 2245 Landover Pl Lynchburg, VA | 1.0–3.0 | 1.0–1.5 | 925 | $870 | $0.94 | 43d | 2 | 0.96mi |
| 4607 Fairmont Ave Lynchburg, VA | 3.0 | 1.0 | 1001 | $1,650 | $1.65 | 21d | 1 | 0.97mi |
| 4612 Greenwood Dr Lynchburg, VA | 3.0 | 1.0 | 1257 | $1,595 | $1.27 | 21d | 1 | 1.00mi |
| 2021 Rose Ln Lynchburg, VA | 2.0 | 1.0 | 836 | $1,095 | $1.31 | 21d | 1 | 1.04mi |
| 2269 Aragon St Lynchburg, VA | 3.0 | 2.0 | 1200 | $1,695 | $1.41 | 43d | 1 | 1.04mi |
| 2336 Aragon St Lynchburg, VA | 2.0 | 1.0 | 1042 | $995 | $0.95 | 13d | 1 | 1.05mi |
| 2121 Langhorne Rd Unit 11041092SF 2BR/2BA Lynchburg, VA | 2.0 | 2.0 | 1092 | $1,495 | $1.37 | 21d | 1 | 1.07mi |
| 2121 Langhorne Rd Unit 1103756SF 1BR/1BA Lynchburg, VA | 1.0 | 1.0 | 756 | $1,225 | $1.62 | 21d | 1 | 1.07mi |
| 2121 Langhorne Rd Lynchburg, VA | 1.0 | 1.0 | 983 | $1,475 | $1.50 | 43d | 1 | 1.07mi |
| 2121 Langhorne Rd Lynchburg, VA | 2.0 | 2.0 | 1142 | $1,575 | $1.38 | 21d | 1 | 1.07mi |
| 4647 Ferncliff Dr Lynchburg, VA | 2.0 | 2.0 | 1034 | $1,800 | $1.74 | 43d | 1 | 1.08mi |
| 209 Munford St Lynchburg, VA | 3.0 | 2.5 | 1420 | $1,497 | $1.05 | 44d | 1 | 1.16mi |
| 1401 Kemper St Lynchburg, VA | 2.0–3.0 | 2.0 | 1118 | $707 | $0.63 | 21d | 6 | 1.25mi |
| 1009 Lindsay St Lynchburg, VA | 3.0 | 2.0 | 1050 | $1,800 | $1.71 | 43d | 1 | 1.27mi |
| 1705 1st St Unit A Lynchburg, VA | 2.0 | 1.0 | 1100 | $1,395 | $1.27 | 21d | 1 | 1.31mi |
| 2518 Carter St Lynchburg, VA | 3.0 | 2.0 | 1091 | $1,500 | $1.37 | 43d | 1 | 1.38mi |
| 1219 Pierce St Unit 1221 Lynchburg, VA | 2.0 | 1.0 | 1168 | $825 | $0.71 | 13d | 1 | 1.39mi |
| 1106 Pierce St Lynchburg, VA | 3.0 | 2.0 | 1018 | $875 | $0.86 | 21d | 1 | 1.40mi |
| 1400 Weeping Willow Dr Apt A Lynchburg, VA | 1.0–3.0 | 1.0–2.0 | 1003 | $1,286 | $1.28 | 13d | 12 | 1.42mi |
| 1105 Fillmore St Unit B Lynchburg, VA | 3.0 | 1.0 | 1300 | $1,250 | $0.96 | 43d | 1 | 1.43mi |
Listing history 13 events
-
2026-05-03status Pending 595-char remark
Show marketing remark (595 chars)
Charming home in the heart of Lynchburg! This adorable 3 bedroom, 2 bath home offers character and convenience. Inside you'll find hardwood floors, spacious rooms, replacement windows and a welcoming layout. The basement adds incredible flexibility with a laundry area, home office, and additional finished rooms ideal for guests, hobbies, or extra living space. A walk-up attic offers even more potential for future expansion. Outside, enjoy a large fenced backyard perfect for kids and pets, off-street parking, and a detached one car garage. Convenient to local colleges, shopping and dining.
-
2026-05-03status Pending 594-char remark
Show marketing remark (595 chars)
Charming home in the heart of Lynchburg! This adorable 3 bedroom, 2 bath home offers character and convenience. Inside you'll find hardwood floors, spacious rooms, replacement windows and a welcoming layout. The basement adds incredible flexibility with a laundry area, home office, and additional finished rooms ideal for guests, hobbies, or extra living space. A walk-up attic offers even more potential for future expansion. Outside, enjoy a large fenced backyard perfect for kids and pets, off-street parking, and a detached one car garage. Convenient to local colleges, shopping and dining.
-
2026-04-29$210,000 Active 595-char remark
Show marketing remark (595 chars)
Charming home in the heart of Lynchburg! This adorable 3 bedroom, 2 bath home offers character and convenience. Inside you'll find hardwood floors, spacious rooms, replacement windows and a welcoming layout. The basement adds incredible flexibility with a laundry area, home office, and additional finished rooms ideal for guests, hobbies, or extra living space. A walk-up attic offers even more potential for future expansion. Outside, enjoy a large fenced backyard perfect for kids and pets, off-street parking, and a detached one car garage. Convenient to local colleges, shopping and dining.
-
2026-04-28$210,000 Active 594-char remark
-
2020-08-25soldstatus $139,100
-
2020-08-24soldstatus $139,100
Show marketing remark (338 chars)
Adorable home in the heart of Lynchburg. 2 Bed/2 BA with an office, laundry and two additional finished rooms on lower level. Features a walk up attic that would be suitabe for extra living space. Large, fenced lot. Off street parking & a detached one car garage. Walking distance to University of Lynchburg. For Comp Purposes Only.
-
2020-07-02$135,000
Show marketing remark (338 chars)
Adorable home in the heart of Lynchburg. 2 Bed/2 BA with an office, laundry and two additional finished rooms on lower level. Features a walk up attic that would be suitabe for extra living space. Large, fenced lot. Off street parking & a detached one car garage. Walking distance to University of Lynchburg. For Comp Purposes Only.
-
2017-08-11soldstatus $117,500
-
2017-03-27$117,500
-
2014-07-28soldstatus $116,000
-
2014-07-25soldstatus $116,000
-
2014-05-06$119,900
-
1996-07-01soldstatus $60,400
ⓘ Source: listings_history table (triggers on properties + properties_extension) + one-shot
backfill from property_details.listing_events for pre-trigger history.
Tax reassessment forecast VA · Resets to sale price
- Current annual tax
- $1,709 · $142/mo
- Projected year-2 tax
- $1,722 · $144/mo
- Expected delta
- +$13/yr (+$1/mo · 0.8%)
ⓘ Screening estimate from a state-policy table — verify with the county assessor before closing.
Climate risk First Street
- Flood 1/10 Low FEMA zone X (unshaded) · 0% chance over 30 yrs
- Wildfire 2/10 Low
- Heat 6/10 Major 7 d/yr ≥101°F today · 18 d/yr by 30 yrs out
- Wind 2/10 Low 3% chance of damaging wind over 30 yrs
- Air quality 2/10 Low 0 unhealthy d/yr today · 1 by 30 yrs out
Nearby sold comps map
Loading sold comps map…
Walkable amenities ~0.75 mi
Loading nearby amenities…
Taxation est. · year 1
- Rental income
- $14,680
- − Mortgage interest
- −$11,763
- − Property taxes
- −$1,709
- − Insurance
- −$1,050
- − Repairs & maintenance
- −$1,174
- − Management
- −$1,174
- − Depreciation
- −$6,109
- Taxable loss
- −$8,299
- Est. tax savings @ 24.0%
- +$1,992
- After-tax cash flow
- $-2,384/yr
For passive investors: Depreciation is non-cash, so a rental often shows a tax loss while cash-flowing — sheltering income. Rental losses are passive: they offset passive income freely, and up to $25,000/yr can offset ordinary (W-2) income if you actively participate and your MAGI is under $100k (phasing out to $0 by $150k); unused losses carry forward. On sale, claimed depreciation is recaptured at up to 25%, and gains may owe capital-gains tax (a 1031 exchange can defer both). Figures are a year-1 estimate at your 24.0% rate — not tax advice; consult a CPA.
Schools (NCES district)
- District
- Lynchburg City Public School District
- NCES district ID
- 5102340
- Math proficiency
- 36% ▼ -38.00%
- Reading proficiency
- 61% ▼ -8.00%
- Median HH income
- $39,097
- Composite
- 40.4/100
- National rank
- #3730
- State rank
- #104 of 131 in VA
Livability — Lynchburg
- Score
- 91/100
- State rank
- #1
- US rank
- #58
Category grades
Schools grade is shown separately in the Schools card above.
Census & demographics
- Census place
- Lynchburg, VA
- County
- Lynchburg City · 97,036 people
- City population
- 97,036
- Metro
- Lynchburg, VA
- Population (ZIP)
- 25,006
- Household income
- $42,222
- Rent vs Own
- Severe rent burden
- 1717.0
Population outlook (Lynchburg County) Hauer SSP2
- Today (2025)
- 87,977 people
- By 2030
- 93,626 · +6.4%
- By 2040
- 106,145 · +20.7%
- By 2050
- 120,783 · +37.3%
- By 2075
- 162,249 · +84.4%
- By 2100
- 191,358 · +117.5%
Race, ethnicity, and origin ACS 2023
- Neighborhood character
- Diverse neighborhood (Simpson 0.55)
- Race & ethnicity
- White 58% Black 34% Two or more races 4% Hispanic / Latino 3%
- Common ancestry
- Slovak 1% Italian 1% Serbian 1%
- Foreign-born
- 3% · Canada
- Languages at home
- 96% English-only · Spanish 2%
Political lean MEDSL · Lynchburg
- 2024 margin
- Lean R (+7.9) · D 45.4% · R 53.3% · Other 1.3%
- 2008→2024 swing
- -3.9pp toward R · 2008: -4.0pp · 2024: -7.9pp
- All cycles
- 2024: R+7.9 2020: D+2.6 2016: R+9.0 2012: R+10.6 2008: R+4.0
Not yet ingested
- Civics
- —
Market trends
- HPI YoY
- ▼ -131.06%
- Current HPI
- 223.6839
- Rent YoY
- ▲ 1.15%
- Metro
- Lynchburg, VA
- State GDP YoY
- ▲ 2.40%
- F500 in state
- 50
Industry mix (Fortune 500 HQ in VA)
| Industry | F500 HQs | Revenue |
|---|---|---|
| Aerospace / Defense | 4 | $236B |
|
||
| Technology / Defense | 3 | $32B |
|
||
| Financial Services | 2 | $176B |
|
||
| Utilities | 2 | $27B |
|
||
| Insurance | 2 | $25B |
|
||
| Technology | 2 | $15B |
|
||
Price history
+239.4% since first listed15 events — show timeline
- 2026-06-11 Sold (MLS) $205,000 LMLS
- 2026-06-11 Sold (MLS) $205,000 MLSRV
- 2026-05-03 Pending — LMLS
- 2026-05-03 Pending — MLSRV
- 2026-04-29 Listed $210,000 LMLS
- 2026-04-28 Listed $210,000 MLSRV
- 2020-08-25 Sold (Public Records) $139,100 Public Records
- 2020-08-24 Sold (MLS) $139,100 LMLS
- 2020-07-02 Listed $135,000 LMLS
- 2017-08-11 Sold (MLS) $117,500 LMLS
- 2017-03-27 Listed $117,500 LMLS
- 2014-07-28 Sold (Public Records) $116,000 Public Records
- 2014-07-25 Sold (MLS) $116,000 LMLS
- 2014-05-06 Listed $119,900 LMLS
- 1996-07-01 Sold (Public Records) $60,400 Public Records
Property tax history
+3.7%/yrLatest (2025): $1,709 · +2.4% YoY. Source: county tax records.
Cash-flow waterfall
monthlySold comps — $/sqft
last 12 mo · ≤1 miLoading sold comps…